I am having a problem with this when trying for small number, less than 1. So instead of 421, 739, 860, 1007, 1306, When trying for 0.421, 0.739 etc., the chart doesn't work. Your directions need to specify the Minus Error bar for the lower whisker and the Plus Error bar for the upper whisker. Then, regardless of the magnitude of the numbers, the Box Plot works.
Good video, but I have one snafu. The high point of my lower whisker and the low point of my upper whisker extend one point into the Q2 and Q3 shaded areas, instead of being on each outer edge as yours does. I have tried subtracting, adding, etc. I don't get it. Mine is set up just like yours, including a 0 axis value.
Disregard. I figured it out. If anyone else does this. You have to enter error bars on Q1 to Q2 series (blanked out one.). Also for lower, you have to click on NEG only. On upper whisker, use POS only
Hi Doug--what if your min value is zero, and the next value is something far larger? I've created a box plot using your technique and it worked like a charm, but I think perhaps I need to deal with outliers differently.
I followed all of these steps, including selecting the 2-D stacked bar chart. When I go to design, Excel does not give me option to switch the row/column. I am using Excel from Microsoft 365 ProPlus. Any advise?
Very helpful. However, the x and y-axis are switched in the 2020 version of excel. I thought the "switch row and column would be the solution but it isn't. Any suggestions?


You're a genuine life saver, thank you Doug so much love
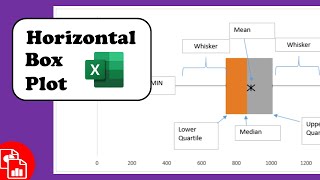
You’re welcome ☺️ glad it helped! Have another that includes mean and median too. ruclips.net/video/evg8AX2mt34/видео.html
Nice. Thank you. FYI, instead of doing all the work again, simply extend the chart data range. Excel automatically uses the existing formatting.
Hi David Murray, thanks for the comment!
Thank you so much for this, such a useful tutorial for producing a vital chart by hand!
Hi William Axtell...you're welcome, glad you liked!
I am having a problem with this when trying for small number, less than 1. So instead of 421, 739, 860, 1007, 1306, When trying for 0.421, 0.739 etc., the chart doesn't work. Your directions need to specify the Minus Error bar for the lower whisker and the Plus Error bar for the upper whisker. Then, regardless of the magnitude of the numbers, the Box Plot works.
Hi Boyce Ferguson, thanks for adding to the thread!
Thanks so much for this super helpful instructional video!
Hi Teresa Schmidt...you're welcome, glad you liked!
Good video, but I have one snafu. The high point of my lower whisker and the low point of my upper whisker extend one point into the Q2 and Q3 shaded areas, instead of being on each outer edge as yours does. I have tried subtracting, adding, etc. I don't get it. Mine is set up just like yours, including a 0 axis value.
Disregard. I figured it out. If anyone else does this. You have to enter error bars on Q1 to Q2 series (blanked out one.). Also for lower, you have to click on NEG only. On upper whisker, use POS only
you went way too fast on the error bars I watched it multiple times and am still having trouble figuring out how you added the second whisker
Bjarb J, that is very interesting...thanks for letting me know.
Slow the speed down! He sounded drunk but that did the trick.. ;)
Hi Doug--what if your min value is zero, and the next value is something far larger? I've created a box plot using your technique and it worked like a charm, but I think perhaps I need to deal with outliers differently.
Haven't tested it with zero min value...try a query to the mrxecel.com forum and see what the gurus say
I followed all of these steps, including selecting the 2-D stacked bar chart. When I go to design, Excel does not give me option to switch the row/column. I am using Excel from Microsoft 365 ProPlus. Any advise?
Hi Joshua Seideman, try a post on the mrexcel.com forum!
I have the same problem:(
this is very helpful! what do I do if I have outliers?
this one covers outliers ruclips.net/video/9TKBSADQpxU/видео.html
@@DougHExcel not a horizontal one anymore
how do I make a “dot” to represent the mean on the whisker plot?
You'd need another row that has the mean value and add it in as a scatter chart. Maybe a vid for the future coming.
@@DougHExcel thanks! But do I add a new row consisting of the mean below the top whisker?
how would you add an outlier?
Very helpful. However, the x and y-axis are switched in the 2020 version of excel. I thought the "switch row and column would be the solution but it isn't. Any suggestions?
Depends on how many series...try to start over and choose one series first to create the boxplot.
I have values on a range from -300 to +300, and it seems your method does not work for data that can be negative... Any tip ?
Hi Raphael Bonnet, sorry 🙁....but try a post on the mrexcel.com forum!
Avoided R Studio on my EMBA Stat final thanks to you! Well done!! feedback from others was very crucial and spot on.
Glad it helped!
Saved my life thanks!
Glad it helped!
why is my whisker is a little bit inside the box? 😭
maybe the size of the chart or plot area? make the chart a bit larger to see
Thanks, this helped me so much!
Glad it helped!
Any tips on how to go about if I want to see all my data points as dots as well?
probably as a separate chart probably scatter ruclips.net/user/dough517search?query=scatter+chart
@@DougHExcel Wow, thanks for the quick reply! I'll try it out!