Размер видео: 1280 X 720853 X 480640 X 360
Показать панель управления
Автовоспроизведение
Автоповтор
Very good. I like this video. May Allah grant you barakah.🤓
Looking forward for more interesting videos. Please make videos about flood management landslide management and air quality map
Thank you brother for sharing the ideas. I'll try to keep your words. Thanks for being with us.
I appropriate thisGood job❤
Wonderful
Really helpful
Thank you so much! It is so helpful.
Welcome
Thank you for sharing
My pleasure
Thank you Sir for your wonderful presentation, but you forgot labelling the titles of each map.
Thanks for your concern 😇
Thank you for your videos, i want to know how to create multiple choropleth maps without coordinate locations or IDW with single legend
Thank you so much
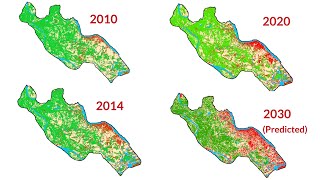
The legends didn’t start from same value. The minimum values of the maps didn’t alligned
Like trend of a diseases for a state district wise distribution for four years with the help of 4 different maps where the data is highly varied
Thanks for the video. Can you say the reason for using interval value of 51 for the grid values?
You need to keep same interval for all of your data so that you can show same data range in the legend for all maps.
Thank u
I tried to do this for my data but for my data I did not change the lowest value for each graph to make the same legend. Do you have any suggestion for me?
Sir I don't find display xy data option
Why u use idw for interpolation do you have any literature to use idw?
I just showed how to create single legend for multiple maps. You can use this process to make single legend. Thanks
@@GISRSSolution thanks for replying but my question is why u use idw for climatic data interpolationDo you have any literature regarding this method
Will you please provide the data used here?
Sorry brother. I have deleted this data after uploading this video. Sorry, I can not help you in this regard. :(


Very good. I like this video. May Allah grant you barakah.🤓
Looking forward for more interesting videos. Please make videos about flood management landslide management and air quality map
Thank you brother for sharing the ideas. I'll try to keep your words. Thanks for being with us.
I appropriate this
Good job❤
Wonderful
Really helpful
Thank you so much! It is so helpful.
Welcome
Thank you for sharing
My pleasure
Thank you Sir for your wonderful presentation, but you forgot labelling the titles of each map.
Thanks for your concern 😇
Thank you for your videos, i want to know how to create multiple choropleth maps without coordinate locations or IDW with single legend
Thank you so much
The legends didn’t start from same value. The minimum values of the maps didn’t alligned
Like trend of a diseases for a state district wise distribution for four years with the help of 4 different maps where the data is highly varied
Thanks for the video. Can you say the reason for using interval value of 51 for the grid values?
You need to keep same interval for all of your data so that you can show same data range in the legend for all maps.
Thank u
Welcome
I tried to do this for my data but for my data I did not change the lowest value for each graph to make the same legend. Do you have any suggestion for me?
Sir I don't find display xy data option
Why u use idw for interpolation do you have any literature to use idw?
I just showed how to create single legend for multiple maps. You can use this process to make single legend. Thanks
@@GISRSSolution thanks for replying but my question is why u use idw for climatic data interpolation
Do you have any literature regarding this method
Will you please provide the data used here?
Sorry brother. I have deleted this data after uploading this video. Sorry, I can not help you in this regard. :(