Thank you for the video. I would probably add that parametric method yet requires historical data for computing volatility (standard deviation) of the returns and, if we measure VAR not from zero, but from the mean of returns, then also the mean. Without these two momentums it is impossible to draw that distribution.
You simulate many possible future scenarios with monte carlo. There are at least two approaches: either you draw with replacement from historical data, either you approximate the distribution of data and draw from it. As for the models themselves, it solely depends on the problem. It can be as simple as one normally distributed variate, or as complex as the need dictates, with many variates that have many complex relationships and unstable parameters.
Thank for upload i have a l;ecture in My university Risk Managment and it is pretty complicated in the lecture but this approach is much easyer to understand. Thanks
Great explanation. I would only argue, that historical approach yet uses the data not only as an ‘excuse’. You would need to know the actual standard deviation (std) number of your portfolio, derived from the historical data to compute VAR. Say, if your historical std is 0.05 and portfolio value is $1000, then in you example VAR = 1.645 x 0.05 x $1000 = $82.25.
so when calculating a 95 percent interval .. you use the 1.96 z value for a critical point and then your test point. my question is: if you used the T value 95 percent interval(1 tailed test of course) the dispersion is much greater so why would someone that is profit bound, want to calculate a 1 tailed z value when they .95 percent interval would be more favorable with a t test?
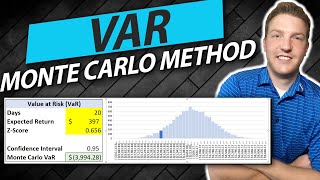
thanks for great 5 min VaR! one question, could you please help to illustrate 1) at the end your data set is asset/portfolio value or returns? 2) in simulation, you simulate returns or values/prices?
The parameters of a normal distribution are estimated by MLE, which is basically a function of data. I doubt that it is correct to say parametric methods rely on 'no data.'
Parametric approaches do not necessarily depend on data: it is possible to inform distributions without data, is the key distinction IMO. Yes, of course, the distributional parameters are calibrated with data (But I do not consider this to be the essential, definitional difference). Once used to parameterize, data can be discarded. On the other hand, non-parametric distributions are data; data is their essence. It's the difference between non needing data, and being data. Further, I think this distinction (informed by Kevin Dowd) is relevent in practice; ie., it's a non-semantic distinction. The role of data in the distributional assumption, is what I mean, is relevant when you go to select a model. For example, parametric extreme value (EVT) is firstly about the properties of a convergent (theoretical) distribution; even before data is used to fit. A non-parametric approach is a different problem that is all about data. Just my opinion.
@khanpreston1. a .95 percent interval means that you , the researcher, is .95 percent sure that your test expected value will lie within the area of interest.. therefore you are then .05 percent unsure that your study is true. distribution mean is the "average of the data" so when you see a bell curve, the data is normally distributed ,(on a sactter plot if you want to use excel and plot some points)
@voiceofutube It is true. It doesn't take into consideration how big losses would be realized at the end of the tails. You could make +/- 0,000001 bucks 99% of the time and lose a fortune 1% of the time and it would say it's ok.
Hello Bionic Turtle. Any chance of you putting out a video of historical VAR simulation adjusted for volatility using EWMA and GARCH. I understand the concepts but am having difficulty rendering the solution in Excel. Regards, Robert.
We usually say worst expected loss b/c it pairs naturally with 9X% confidence level; e.g., Kevin Dowd's usage and I noticed the new C. Bacon (2nd ed) uses "VaR measures the worst expected loss over a given time interval under normal market conditions at a given confidence level." (two authorities if ever there were!), but yours is fine too, of course, as users do understand (we even see 0.05 and 0.95, eg, used interchangeably b/c users know its only the loss tail). Your has an important advantage: it emphasizes that VaR has no information on the (conditional) loss tail. I always say that what's important is that *VaR is a quantile.*
Hello! You may find our forum helpful in answering this question, as there is a great deal of discussion on Monte Carlo Simulation. If you use the search function in our forum, you will find that there are many threads discussing this: www.bionicturtle.com/forum/. I hope this helps!
tanta vigiladera extremista es dañina a veces. aqui y ahora. dejo constancia. la echo o utilizar para la reflexion? . ;) . Paz bro'. postdata: el metodo montecarlo puede servir para otras ramas, no solo economia y finanzas, sino tambien la rama de la medicina (la cual le queda poco tiempo de vida ).


Some people have unique and natural ability to explain concepts in a simple manner.👌
Thanks so much for your kind words!
After tons of time reviewing the concept of Var, I start to question whether Var is a good way to communicate the risk.
Thank you for the video. I would probably add that parametric method yet requires historical data for computing volatility (standard deviation) of the returns and, if we measure VAR not from zero, but from the mean of returns, then also the mean. Without these two momentums it is impossible to draw that distribution.
You simulate many possible future scenarios with monte carlo. There are at least two approaches: either you draw with replacement from historical data, either you approximate the distribution of data and draw from it. As for the models themselves, it solely depends on the problem. It can be as simple as one normally distributed variate, or as complex as the need dictates, with many variates that have many complex relationships and unstable parameters.
@jimmymac91 It's not easy being green (but i can see how you confuse a turtle with a frog, easy mistake)
Thank for upload i have a l;ecture in My university Risk Managment and it is pretty complicated in the lecture but this approach is much easyer to understand. Thanks
+Shinnysmilever You're welcome! We are happy to hear that our videos are so helpful. Thank you for watching!
Great explanation. I would only argue, that historical approach yet uses the data not only as an ‘excuse’. You would need to know the actual standard deviation (std) number of your portfolio, derived from the historical data to compute VAR. Say, if your historical std is 0.05 and portfolio value is $1000, then in you example VAR = 1.645 x 0.05 x $1000 = $82.25.
so when calculating a 95 percent interval .. you use the 1.96 z value for a critical point and then your test point. my question is: if you used the T value 95 percent interval(1 tailed test of course) the dispersion is much greater so why would someone that is profit bound, want to calculate a 1 tailed z value when they .95 percent interval would be more favorable with a t test?
thanks for great 5 min VaR! one question, could you please help to illustrate 1) at the end your data set is asset/portfolio value or returns? 2) in simulation, you simulate returns or values/prices?
Thank you very much. Just what I needed
very clear, thank you!
Many thanks to you !!
Merci beaucoup Well done
How Parametric Var curve is created without Normal data ?
The parameters of a normal distribution are estimated by MLE, which is basically a function of data. I doubt that it is correct to say parametric methods rely on 'no data.'
Parametric approaches do not necessarily depend on data: it is possible to inform distributions without data, is the key distinction IMO. Yes, of course, the distributional parameters are calibrated with data (But I do not consider this to be the essential, definitional difference). Once used to parameterize, data can be discarded. On the other hand, non-parametric distributions are data; data is their essence. It's the difference between non needing data, and being data. Further, I think this distinction (informed by Kevin Dowd) is relevent in practice; ie., it's a non-semantic distinction. The role of data in the distributional assumption, is what I mean, is relevant when you go to select a model. For example, parametric extreme value (EVT) is firstly about the properties of a convergent (theoretical) distribution; even before data is used to fit. A non-parametric approach is a different problem that is all about data. Just my opinion.
Good video. Greetings!
Thank you for watching!
Great, thank you!!
Which approach is best one to use ?
@khanpreston1. a .95 percent interval means that you , the researcher, is .95 percent sure that your test expected value will lie within the area of interest.. therefore you are then .05 percent unsure that your study is true. distribution mean is the "average of the data" so when you see a bell curve, the data is normally distributed ,(on a sactter plot if you want to use excel and plot some points)
Thanks! That is helpful.
Thank you verry much!
great explanation! thanks~
@voiceofutube
It is true. It doesn't take into consideration how big losses would be realized at the end of the tails. You could make +/- 0,000001 bucks 99% of the time and lose a fortune 1% of the time and it would say it's ok.
Hello Bionic Turtle.
Any chance of you putting out a video of historical VAR simulation adjusted for volatility using EWMA and GARCH.
I understand the concepts but am having difficulty rendering the solution in Excel.
Regards, Robert.
How sure you are about the .95 percent depends on your P value which should be discussed. how sure is your 95 percent. 10 percent sure.. ? 50 percent?
minimum (not worst) expected loss at a given probability level. No?
We usually say worst expected loss b/c it pairs naturally with 9X% confidence level; e.g., Kevin Dowd's usage and I noticed the new C. Bacon (2nd ed) uses "VaR measures the worst expected loss over a given time interval under normal market conditions at a given confidence level." (two authorities if ever there were!), but yours is fine too, of course, as users do understand (we even see 0.05 and 0.95, eg, used interchangeably b/c users know its only the loss tail). Your has an important advantage: it emphasizes that VaR has no information on the (conditional) loss tail. I always say that what's important is that *VaR is a quantile.*
loved the video, really cleared things up thanks!
But i 5:52 actually cracked me up lol
actually.. this data is pretty normally distributed.. more so than many others. and the normal dist. at 2:32 is more unrealistic in real life.
Spread products
What is Monte Carlo Simulation? Why is it called that?
Hello! You may find our forum helpful in answering this question, as there is a great deal of discussion on Monte Carlo Simulation. If you use the search function in our forum, you will find that there are many threads discussing this: www.bionicturtle.com/forum/. I hope this helps!
@sysopkc I think. you are supporter of Nassim Nicholas Taleb's view which he described in his book "Black Swan"...?
tanta vigiladera extremista es dañina a veces. aqui y ahora. dejo constancia. la echo o utilizar para la reflexion? . ;) . Paz bro'. postdata: el metodo montecarlo puede servir para otras ramas, no solo economia y finanzas, sino tambien la rama de la medicina (la cual le queda poco tiempo de vida ).
Does anyone else think he sounds like kermit the frog?
James Macintyre yes