Finding Probabilities for a normal distribution using a TI-83/84 calculator

HTML-код
- Опубликовано: 11 сен 2024
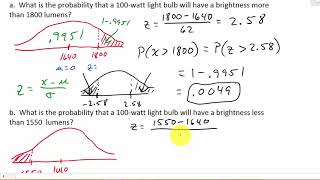
- Probabilities for a normal distribution can be found by using the raw scores and the statistical programming in a TI-83/84 graphing calculator or a statistical software package.


One of the Best explanations and directives given !!
Thanks for showing me how to use the calculator to find this. Very easy to follow.
Having a textbook only for an online statistics class is not easy. You have provided great understanding. Thank you!
a million times better than my teacher, thanks
Thank you for a clear explanation. Very easy to follow.
Great video, very well explained
Thanks
Thank you so much !
why 9999?
because its infinite
Thank You so much :) God bless
thanks so much for this great video
what happens if you don't have the lower or higher bounds? Just used both negative and positive 10^99
Hello Professor,
Do you have any how to find probabilities from disjoint even and join event?
Thanks
How she get 0.841
Cant get it
why do u use 9999 at the high?
Using 9999 or 1E99 gives a very large value for the idea of going to the extreme right. Using such a large number helps you when you go to the raw data and the values are large.
I have a question? Six hundred candidates wrote an entrance test for admission to a management course offered by the MANCOSA GSB. The marks obtained by candidates were found to be normally distributed with a mean of 132 marks and a standard deviation of 18 Marks , How many candidates scored between 140 and 160 marks?
0.2706
First find the percent by normalcdf(140,160,132,18)=0.26845
Next, multiply that percentage to 600 to get 161.07 or 161
Are you related to Ezra Koenig? :0 haha
how are you got 0,841
I didn't understand
I DON'T HAVE A CALCULATOR!
Then you need to use a table of the standard normal curve. These tables are organized by the ones and tenths of the z-score along the left edge of the table and the hundredth along the top. From that you will get the percentile. You have to use symmetry and adding or subtracting to fit the specific question.