Thank you so much. It's been years now that I stopped studying and haven't reviewed probability until such time that my friend asked for help with regards to this topic. I almost forgot the Z table until I found your video and get to remember the table. Your video is very helpful. Thanks for the steps.
Omg.. sir the moment you drew the 'z' variable in Standard Normal Deviation, everything about my probability class just made so much more sense. I'm so grateful I stumbled on your video. Thank youu!!
Thank you so much @jason delaney! My professor has never once given how to do problems with a step by step check list like this. It makes it soooo much easier to understand and solve. I hate stats so much and this makes it easy!
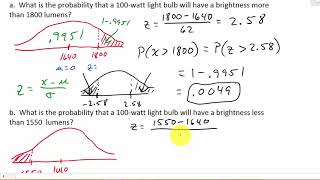
there is a problem in the first Q? ........the value of P in green is 0.7995 rather than 0.2995??? Z score table value at 0.8432 is 0.7995 not 0.2995 check plzz
For those of you who were asking why are the z score tables different: There are three types of normal distribution tables. He is using this one: faculty.ccp.edu/faculty/sgramlich/251/tablea-2.3.jpg www.mathsisfun.com/data/standard-normal-distribution-table.html
Sir Jason your video has helped me a lot but i want to know when to use a normal distribution when you are a given a problem instead of binomial, poisson or hypergeometric
I'm so confused right now. How come your z-table different from mine? all the numbers are different by 0.5. For example, in your table, z (1) = 0.3413. However, my tables give z(1)= 0.8413
Hi,@7:25, your z-table looks different than what I have. my z-table starts with 0.500 instead of 0.000 in the first box from the top left column. Why? How are the two z-tables different? I have attached my version of the z-table for you to compare. www.stat.ufl.edu/~athienit/Tables/Ztable.pdf
I also have that version, it gives the WHOLE area to the left of Z, and it gives the area from 0 to the number he's looking for so ours helps us skip one step. all we have to do is subtract 1 to the area in the 1st problem and we get the area to the right of Z :)
Those who use the normal distribution should always be aware that the independent values range from -infinity to +infinity. In reality, nothing has this range.
On P for the first problem, When you were using the Z table why did you go over to .4? I understand why you went to .8 because that's what Z began with, I just don't understand where the .4 came from.
Hi Jason, First thank you so much for wonderful easy way teaching,My question is , I understand 100% what you did in second stock example, but I don't understand the question meaning itself , the 40.578 will but the company in the top 10% , 10% of what ? is this top 10% related to understand what S&P500 is? ,I try to understand how can link statistics to the real world.Thanks again
Someone Posted this earlier Hi,@7:25, your z-table looks different than what I have. my z-table starts with 0.500 instead of 0.000 in the first box from the top left column. Why? How are the two z-tables different? I have attached my version of the z-table for you to compare. www.stat.ufl.edu/~athienit/Tables/Ztable.pdf PLEASE ANSWER! I need to know asap!!
In Excel, you can use =NORM.S.DIST(), making sure that you are using the cumulative distribution function. For example, entering =NORM.S.DIST(0.84,1) will give you 0.7995 (0.5 for the left half + 0.2995 from this table). Check the help file for more.
Rohit Kashyap if you choose 1.28, that means there is 0.3997 between 0 and z or 0.5 - 0.3997 = 0.1003 in the upper tail. choosing 1.29 leaves 0.5 - 0.4015 = 0.0985 in the upper tail. The company wants their upper tail to be
sir Jason how to solve a normal distribution with mean=10 and SD=6 what is the area below 32? area above 27? area between 42 and 51? the x value that has 45% of the area below it? the x value that has 13% of the area above it? please answer for me sir
at 11:40 you said "0.4 will be our P" but when you look up for Z you go to 0.8 and in the first example at 7:40 you got ur Z from the 0.4 p's column !?!? can you explain this for me please ?! thanks
Jacob Siegle thanks a lot,, i was a little bit nerves and i didn't get at the moment but i understood it after thinking a while !! .. and i passed in the exam :) thanks for reply


My Goodness, this video was a life saver! I don't know who you are, but I love you.
Words cannot express how much this helped me. Simple and let me understand the concept far easier then what my book was showing it. Thanks!
Thank you so much. It's been years now that I stopped studying and haven't reviewed probability until such time that my friend asked for help with regards to this topic. I almost forgot the Z table until I found your video and get to remember the table. Your video is very helpful. Thanks for the steps.
Omg.. sir the moment you drew the 'z' variable in Standard Normal Deviation, everything about my probability class just made so much more sense. I'm so grateful I stumbled on your video. Thank youu!!
Thank you so much @jason delaney! My professor has never once given how to do problems with a step by step check list like this. It makes it soooo much easier to understand and solve. I hate stats so much and this makes it easy!
learnt more in this vid than a term at uni.... appreciate it man!
this video has helped me understand this topic so much better. thank you!!
The first example is incorrect right? It was asking for more than 18,000 so you would have to use =1- I(.84322)
Thank you Dr. Delaney - appreciate the assistance.
Great Video! Prepped me for my exam tomorrow!
great video... Much appreciated.
Thanks darling! This was right what I needed an hour before my exam
Polite applause
helped me with one of my AP stats tests.
Thank you sir
HI Jason, Awesome! you kicked a goal on this one. Cheers
Really helpful. Would be awesome to see more practice questions getting solved by you on binomial distribution data..
Hey
Amazing video, great explanation, helping students arround the world :)
Wow Thank you so much sir for this helpful video ill definitely recommend this to my friends
Love you bro, saved my exam..
Understood completely🤩. Thankyou
there is a problem in the first Q? ........the value of P in green is 0.7995 rather than 0.2995???
Z score table value at 0.8432 is 0.7995 not 0.2995 check plzz
You made my understanding to be much easier,😘😘😘
Thanks bro
For those of you who were asking why are the z score tables different: There are three types of normal distribution tables.
He is using this one:
faculty.ccp.edu/faculty/sgramlich/251/tablea-2.3.jpg
www.mathsisfun.com/data/standard-normal-distribution-table.html
This video is very helpful!
thanks man, you are a life saver!
Sir, you have saved my life TYVM
thank you so much for this! really really helpful!!
thanks man this really help me understand
You did awesome!
THANK YOU!! This was very helpful!
HEY MAN GOD BLESS YOU THANK YOU VERY MUCH IT WAS REALLY USEFUL!!APPRECIATED!
Thanks, Lucy! Let me know if you run into any problems or have any recommendations.
thanks man, this video increased your subscirber by one
Thank you very much. Very usefull.
Sir Jason your video has helped me a lot but i want to know when to use a normal distribution when you are a given a problem instead of binomial, poisson or hypergeometric
I'm so confused right now. How come your z-table different from mine? all the numbers are different by 0.5. For example, in your table, z (1) = 0.3413. However, my tables give z(1)= 0.8413
i dont understand is 0.8432 the area of z or the value of z? if yes, then why are you looking for the area between 0-Z?
Hi,@7:25, your z-table looks different than what I have. my z-table starts with 0.500 instead of 0.000 in the first box from the top left column. Why? How are the two z-tables different? I have attached my version of the z-table for you to compare.
www.stat.ufl.edu/~athienit/Tables/Ztable.pdf
I also have that version, it gives the WHOLE area to the left of Z, and it gives the area from 0 to the number he's looking for so ours helps us skip one step. all we have to do is subtract 1 to the area in the 1st problem and we get the area to the right of Z :)
Those who use the normal distribution should always be aware that the independent values range from -infinity to +infinity. In reality, nothing has this range.
very helpful! thank you
On P for the first problem, When you were using the Z table why did you go over to .4? I understand why you went to .8 because that's what Z began with, I just don't understand where the .4 came from.
I went over to .04, because z was 0.84, so you go down to 0.8, over to 0.04 because 0.84 = 0.8 + 0.04.
tomorrow I have a maths exam and my birthday, wish me a great marks
Hi Jason, First thank you so much for wonderful easy way teaching,My question is , I understand 100% what you did in second stock example, but I don't understand the question meaning itself , the 40.578 will but the company in the top 10% , 10% of what ? is this top 10% related to understand what S&P500 is? ,I try to understand how can link statistics to the real world.Thanks again
On the normal distribution table isn't 0.8/0.4 .7995?
you are right its 0.7995
exactly.
thank you very much.
shouldnt it have been 1 - 0.2995?
Hi this video is very informative. Can I use this for educational purpose?
You can share the link, by all means.
Thank you..
and why is that our z-tables are different?
Someone Posted this earlier
Hi,@7:25, your z-table looks different than what I have. my z-table starts with 0.500 instead of 0.000 in the first box from the top left column. Why? How are the two z-tables different? I have attached my version of the z-table for you to compare.
www.stat.ufl.edu/~athienit/Tables/Ztable.pdf
PLEASE ANSWER! I need to know asap!!
Is there any other method I can use to find P other than using that table?
In Excel, you can use =NORM.S.DIST(), making sure that you are using the cumulative distribution function. For example, entering =NORM.S.DIST(0.84,1) will give you 0.7995 (0.5 for the left half + 0.2995 from this table). Check the help file for more.
can you please elaborate why you've taken Z=1.29 ?
Rohit Kashyap if you choose 1.28, that means there is 0.3997 between 0 and z or 0.5 - 0.3997 = 0.1003 in the upper tail. choosing 1.29 leaves 0.5 - 0.4015 = 0.0985 in the upper tail. The company wants their upper tail to be
thank you :) 😊
Great video! Have an exam on this coming up and figuring it out from the book alone isn't that helpful :)
sir Jason how to solve a normal distribution with mean=10 and SD=6 what is the area below 32? area above 27? area between 42 and 51? the x value that has 45% of the area below it? the x value that has 13% of the area above it? please answer for me sir
Whoa!! Thank you soo much😊
really helpful!! x
at 11:40 you said "0.4 will be our P" but when you look up for Z you go to 0.8
and in the first example at 7:40 you got ur Z from the 0.4 p's column !?!?
can you explain this for me please ?! thanks
Lets say you had the number 0.86. You go to the 0.8, and then to the 0.06. 0.8 + 0.06 = 0.86 our original number.
Jacob Siegle thanks a lot,, i was a little bit nerves and i didn't get at the moment but i understood it after thinking a while !! .. and i passed in the exam :)
thanks for reply
yaya NHO
Congrats on your exam!
Nice video
it's 0.7995, not 0.2995
you're using a different table, one that shows P(z
thanks, got it
OMEGALUL
My question is why did you pick 1.2 for z value
We picked 1.29 because it is the closest (on the table) to have 0.4000 between 0 and z that also has at least 0.4000 in there.
Thanks. But wish you replied earlier tho.
Thanks...helpful
Thank you a hundred times. Really wasn't getting it :)
Thank you.
Very helpful
Hi can u please draw a multiple bell-shaped graph on excel i mean singles bells all merged in on graph
How can we do it without using statistical table?
Sanchit Agarwal you can use excel functions or a statistical calculator. in principle you can evaluate the cdf by hand.
cdf, by using the pdf of Normal distribution with mean 0 and variance 1?
Would be more helpful if you included the link to the .pdf you are using...
thank you
Damn helpful
Why couldn’t you just do it on a piece of paper?!
it would be easier just to use a z-table of tail probabilities
Yep. But that's not what my students had. :) Best is to know how to use all of them.
normal distribution
0,8432 on the table is 0,7995 not 0,2995
there are 3 types of normal distribution table. You are using different table than what he is using..
Te amo
Please don't smack your lips. It's like nails on a chalkboard. Other than that, nice video.
I didn't mean it lol. The internet is anonymous (enough) whooo!
your video was great but try not to do so much smacking your lips
stop making so many noises , its irritating , making one think that you are chewing gum
Gujarati drama
Great video! Have an exam on this coming up and figuring it out from the book alone isn't that helpful :)