I am so sorry about my "hi". I will definitely ensure that my "hi" is more mellow. I have received quite a lot of criticism regarding my "hi" .. haha. Anyway I sincerely hope you enjoyed the content though :)
I never had the habit of commenting for any videos which is helping me, but i really got admired from your video which contains clear idea and i sholud mention,the way you teach is so energetic and keep us very interesting to learn more ...keep doing your best work🙂 you deserve more subscribers!!!!!
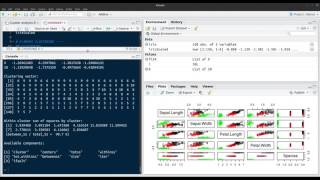
Hello EasyML Awesome tutorial video. I wanted to know how can we determine the individual components of a cluster? What each of these blue and orange dots represents on the autoplot? Please help. Thanks in advance.
Pls someone helps me. When i run autoplot(KM,mydata,frame=TRUE). I got into trouble like this: Error: Objects of type kmeans not supported by autoplot. Run `rlang::last_error()` to see where the error occurred. Objects of type kmeans not supported by autoplot. Backtrace: 1. ggplot2::autoplot(KM, mydata, frame = TRUE) 2. ggplot2:::autoplot.default(KM, mydata, frame = TRUE) Run `rlang::last_trace()` to see the full context. Objects of type kmeans not supported by autoplot. Backtrace: x 1. +-ggplot2::autoplot(KM, mydata, frame = TRUE) 2. \-ggplot2:::autoplot.default(KM, mydata, frame = TRUE)
Thanks, this was really helpful. I was able to find 3 clusters using 33 census data variables on housing and demographics. However, I want to know how to classify each census tracts according to the clusters I've found so that I can map them and test out my hypothesis. Let me know if you have any insight into this, thanks :)
@@abhitejthummala Sure! Basically what I did was keep the census tract column of my data (census tract FIPS code allows you to map data on ArcGIS), but I did the K Means analysis omitting the first column. After I did my cluster analysis, I appended it to my original data frame. This was my code after the kmeans: # K-Means Cluster Analysis KM
Hello! It is very helpful but I have my own data and when I want to use the function autoplot appears this error "'`[.data.frame`(plot.data, , c(x.column, y.column))':" I don't know how to fix this :-(
My autoplot(KM, mydata, frame= TRUE) doesn't work. I run it and it doesn't do anything. I have to point out that I didn't run the wssplot function though. Is it because of that? I fixed it. It's because of my lack of R syntax knowledge! I have no idea why but I am running R in vscode and vscode doesn't print the variables if they are not in a print function.
nc can be more than 15 too no hard and fast rule. If you have more that 15 clusters that means it is a very large dataset then you might need to use other packages like clara (clustering of large applications)
Can someone explain to me how and what ending do I know what each color of the chart means? In the example of video in graphic we have red and green what they mean or how do you I know what they means ?
Hi I do apologize for that. I have never made a youtube video and when I was recording this video I was constantly paranoid about the audio quality hence it came out this way. I sincerely hope the content was useful. The feedback regarding my voice / tone will definitely be incorporated in my upcoming videos. Sorry once again


WSSPLOT FUNCTION CAN BE FOUND HERE :-
rpubs.com/violetgirl/201598
Thank you for being fully resourceful
your "hi" scared the shit out of me :)
I am so sorry about my "hi". I will definitely ensure that my "hi" is more mellow. I have received quite a lot of criticism regarding my "hi" .. haha. Anyway I sincerely hope you enjoyed the content though :)
Thank you for sharing your knowledge. It was very useful. I got my problem resolved after watching your video.
What an excellent explanation. To the point but you still manage to dumb it down. Thank you so much!
I never had the habit of commenting for any videos which is helping me, but i really got admired from your video which contains clear idea and i sholud mention,the way you teach is so energetic and keep us very interesting to learn more ...keep doing your best work🙂 you deserve more subscribers!!!!!
Thank you so much! Really means a lot :)
I had to stop the video to appreciate you for such a wonderful tutorial.
Sir, You are a Good TEACHER, Short and sweet explanation, Superb
Hello, thanks for great video! It is heelpful. What do you suggest for stability test in r? Which function I can use?
Excellent video!! Thank you so much
Great video! You present every step very clearly.
Thank you 🙏
Thanks , How can I use fuzzy k-means (FKM) to impute missing in R?
Hello EasyML
Awesome tutorial video. I wanted to know how can we determine the individual components of a cluster? What each of these blue and orange dots represents on the autoplot? Please help.
Thanks in advance.
Hello. Very helpful video! How do I put species names in the plot?
Thank you man, you finally made it made sense!
Thanks a lot for your comment Like / Share and Subscribe 🙏
Very helpful play list. Thanks a lot
Pls someone helps me. When i run autoplot(KM,mydata,frame=TRUE). I got into trouble like this:
Error: Objects of type kmeans not supported by autoplot. Run `rlang::last_error()` to see where the error occurred.
Objects of type kmeans not supported by autoplot.
Backtrace:
1. ggplot2::autoplot(KM, mydata, frame = TRUE)
2. ggplot2:::autoplot.default(KM, mydata, frame = TRUE)
Run `rlang::last_trace()` to see the full context.
Objects of type kmeans not supported by autoplot.
Backtrace:
x
1. +-ggplot2::autoplot(KM, mydata, frame = TRUE)
2. \-ggplot2:::autoplot.default(KM, mydata, frame = TRUE)
Thanks for making kmeans so clear and easy to understand
very insightful tutorial
Thanks, this was really helpful. I was able to find 3 clusters using 33 census data variables on housing and demographics. However, I want to know how to classify each census tracts according to the clusters I've found so that I can map them and test out my hypothesis. Let me know if you have any insight into this, thanks :)
Never mind, I figured it out!! Haha. Thanks again.
@@underpressure16 for more queries please write to easyml123@gmail.com. Sorry for the delayed response
@@underpressure16 Could you please let me know how did you map the rest of your data to the clusters, thanks!
@@abhitejthummala Sure! Basically what I did was keep the census tract column of my data (census tract FIPS code allows you to map data on ArcGIS), but I did the K Means analysis omitting the first column. After I did my cluster analysis, I appended it to my original data frame. This was my code after the kmeans:
# K-Means Cluster Analysis
KM
@@underpressure16 Yeah I just figured it out, thanks for the reply, appreciate it.🙌
It is very helpful. Why you stopped making videos, please start
So glad to see 85k views!
Hello! It is very helpful but I have my own data and when I want to use the function autoplot appears this error "'`[.data.frame`(plot.data, , c(x.column, y.column))':" I don't know how to fix this :-(
This was really helpful! Thank you!
very informative , i have done same kmean cluster , but i am confused how i find which species was in which cluster
Hello, did you find any solution to this problem?
@@DaNiel-gc3yr no, are you know?
www.geeksforgeeks.org/k-means-clustering-in-r-programming/
the way of explanation is awesome
Thank you ur vedio brought me a hope that R is easy
This was so helpful thank you
how do you determine what each cluster represents?
My autoplot(KM, mydata, frame= TRUE) doesn't work. I run it and it doesn't do anything. I have to point out that I didn't run the wssplot function though. Is it because of that? I fixed it. It's because of my lack of R syntax knowledge! I have no idea why but I am running R in vscode and vscode doesn't print the variables if they are not in a print function.
Very good video. Succinct and to the point.
This channel is amazing
in the WSS formula why is nc = 15 and seed 1234?
nc can be more than 15 too no hard and fast rule. If you have more that 15 clusters that means it is a very large dataset then you might need to use other packages like clara (clustering of large applications)
Can someone explain to me how and what ending do I know what each color of the chart means?
In the example of video in graphic we have red and green what they mean or how do you I know what they means ?
A very ''powerful'' video!
Excellent video. Kudos to you.
Thank you for your kinds words :)
Hi, am new to R. how do we upload data to R?
ruclips.net/video/ZZtgB6DZKxs/видео.html
Awesome and simple
how to export our cluster result in excel or csv?
How can we predict the classification of a completely new data?Can anyone share the code with me please?
is SSE same as WSS?
Bang kalau pake data citra data raster bisa nggak?
Very good
what is nc in WSS function?
Ok I got what is nc!!
Hello, Can you help me please
kaget cok
why iris again!!!
Easiest place to start I guess. I know it is extremely simplistic but it is quite effective for beginners :)
Not getting ggfortify
Why do you shout at audience?
Hi I do apologize for that. I have never made a youtube video and when I was recording this video I was constantly paranoid about the audio quality hence it came out this way. I sincerely hope the content was useful. The feedback regarding my voice / tone will definitely be incorporated in my upcoming videos. Sorry once again
@@easyml1234 OK and all the best! :)