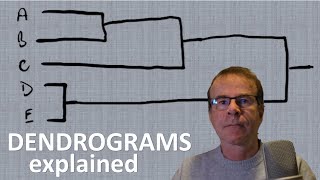
Visualizing clusters in R | Hierarchical clustering

HTML-код
- Опубликовано: 7 авг 2024
- In this video, you will learn enhanced visualization of clustering dendrogram using R studio.
The Video will include:
• Importing data file and formatting variables
• Distance matrix computation
• Hierarchical clustering
• Using colors in the dendrogram
• Draw and fill rectangles around the clusters
• Using themes of ggplot2
• Changing type of dendrogram
• Using different layouts for phylogenic dendrogram
=============
Download Links
=============
Download R-script - visit this blog:
agroninfotech.blogspot.com/20...
R is free software and you can download it from the link given below
www.r-project.org/
Download link for R studio
www.rstudio.com/products/rstu...
====================
Get connected with us on
====================
Facebook page: AgronInfoTec...
Twitter: / agroninfotech
Linked In: / agron-info-tech-7429a6156
____________________________________________
If you have any question please comment below.
Thanks for watching this video.
#HierarchicalClustering
#DistanceMeasuring
#RStudio


Thank you so much Sir for this tutorial. I was able to plot a cluster analysis in R for the first time.
Thank you very much for this tutorial! very helpful for me
You are most welcome dear
This is gorgeous work! Thank you
I am so glad you like it. Thanks
very nice presentation
Very beautiful tutorial. Awesome video. Keep going ! Btw we have to install packages "igraph" for the phylogenic graphs.
Thanks for your compliments.
Thank you so much, it was very helpful
You are welcome
Very helpful. Thankyou.
You are welcome
نفع الله بك يا صديقى
Thanks dear
Hello Dear ,I want to cluster my pressure level seasonal specific humidity data,
how can do that or such single variable data clustering in pressure leve.thank you so much.
hi Info-Tech. I need use to dendro.variables package, can you help me? How do you use dendro.variables package in R?.... Please.
Good job
Thanks brother
great job
Thanks for your support
what a great job!
Thanks
@@AGRONInfoTech I have a question. Is there any script to compare dendrograms in R? Thank you very much
Can you please tell me how you want to compare?
@@AGRONInfoTech Thank you, I want to compare to dendrograms with the same method (method = "ward.D2") but with different data.
@@AGRONInfoTech I'm working with an script for theses comparision but it tells me an error, this one:
Error in dendlist(dendrogram1, dendrogram2) :
Some of your object's classes are not of the type dendrogram/hclust/phylo/dendlist. Please review and fix. Their classes are:
data.frame, data.frame
Please could you tell me How do I change data.fram class to dendrogram/hclust/phylo/dendlist class?
Thank you very much
Very great video sir, but how to interpret it. Do you have any recommendation
Some detail is here in blog post
agroninfotech.blogspot.com/2020/06/visualizing-clusters-in-r-hierarchical.html
Thanks author for sharing the valuable tutorial. However, when I run rownames(data)
The variable values of X that you want to set as row names should not contain duplicate values.
Further following below commands may fix the issue.
data =as.data.frame(data)
X = data$X
data = data[ , -1]
rownames(data) = X
In above commands -1 should be the variable number representing X. If still you are unable to set X variable as rownames then send your data file at agron.infotech@gmail.com
Hi thank you for this tutorial and Rscript. May I ask how to set the height scale? For example height from 0.0 to 1.0?
Just add below layer to your code after + sign
ylim(c(0, 1))
The tutuorial is helpful. How do you add a title to a cluster?
You can use the argument main = "Title here" for both type of plots either drawn with plot() function or with fviz_dend() function.
Hi, great video. I got a question, what would you advice me in case I have one o two outliers in the columns (variables) of my dataset. Should I remove them? Should I replace them for NA or zero? Thanks a million
You can handle outliers as mentioned below:
1. Trim your data if you very well know the range of the variable values.
2. Trim the data but replace the outliers with mean or median which best suits to the variable range (winsorization)
3. If you want to keep the outliers you may transform the data (Google methods of data transformation)
@@AGRONInfoTech Very nice, thank you very much!
You are most welcome
@@AGRONInfoTech I applied that and it goes very well. Is there any paper to may cite for that? In that case, could you give me that name of that reference? Thanks!
You may search on Google. There will be many research papers on this aspect.
Awesome video! Easy to understand! Please can I get the script
Thanks. You can download the script from the link provided in the description of this video.
Please do you have a video for HEATMAPS. Thank you Sir
If you share the dataset at agroninfotech@gmail.com then is shall send you script on plotting heatmap.
Thank you so much for your very nice explanation. Very helpful. Could you please provide the script?
Thanks for your support. You can download Rscript from the link provided in description of this video.
@@AGRONInfoTech thank you very much!
You are most welcome
Hey guys, I need help with dendrogram labels. I have 20 countries I am clustering but they are represented by numbers in the output. How do I rename them?
The categorical variable should be changed to rownames if you want to label them in clusters instead of numbers. I think row numbers are being printed instead of country names.
rownames(data) = data$country
The country in the above command is the variable name specify countries.
You really did a great job here...... Can I get this script va mail?
See inbox plz
Excellent Job. I am facing a problem, after clustering when we are going to assign colors to cluster it is giving this error"could not find function "fviz_dend". How to deal with it
Did you load the package factoextra using library(factoextra) or require(factoextra) command?
You may also require(igraph) package
If still have problem let me send the screen shot at agron.infotech@gmail.com
@@AGRONInfoTech Thanks a lot for your positive response. Your comments helped me and I solved it. Can you make a video about various diversity parameters calculation using genotypic data (dominant marker data as 1 and 0).
Dear Author
Thank you so much for very informative tutorial about cluster dendrogram.
Please give me solution below problem
When I run below script
require(stats)
res.hc
May be you have not properly created object res.hc
If you share your complete code then I may be able to answer it.
Dear author, I follow your tutorial step by step, however, when I run" rownames(data)=c(data$X), there was warning message: "Setting row names on a tibble is deprecated". How can I solve that error? Thank you very much!
Do variable X contains any duplicate values ?
@@AGRONInfoTech I have checked through but there was no duplicated data in rownames. I also send data set via email for your helps. Many thanks in advance!
Hi, I just run the data set CSV file in R. The following codes worked perfectly for replacing first variable as rownames.
df = read.csv(file = 'data1.csv',
header = T)
rownames(df) = c(df$ï..X)
df = df[,-1]
@@AGRONInfoTech Thanks you so much for your kind help indeed. Wishing you all the best!
Thank you very much for these details explanations, sir.
I have one problem with the figure representation. I do not get names (station names, in your case US state names) from the first column in the dendrogram graph when I use fviz_dend () function. It gives clusters of values rather than names. But in plot function, using this one plot(x= res.hc, labels = greenspace$station_id ) I can get clusters of stations name. I want to get the complete final output of fviz_dend ().
Here is my code: # creating clustering
require(stats)
res.hc
The row names were not correctly defined. I have sent you an email with an updated Rscript that will generate a clustering dendrogram with proper labels. Hope it will be useful for you...
@@AGRONInfoTech 🙏🙏
so generous of you. Thank you very much for correcting the scripts
@@AGRONInfoTech Is it possible to get an email too with this updated Rscript please?
Share your email please
Please tell how to create CSV file for variables
I am not sure which file you want to convert to CSV. If you have an excel file then go to files menu, choose 'save as' and in file type you can select comma delimited (CSV) format.
Sir, change variable to character type done but change column variable as row names... It's not done, 😢 show: Error in'.....
Duplicate 'row.names' are not allowed.
So what can I do sir? Please solve the problem.
You cannot set rownames where the values are duplicated. For rownames all the values should be unique.
@@AGRONInfoTech i changed the variable to character type then next step but my group data not changed, alls are same that's why it show error & duplicated.
Dear Sir, Could you please help me how to make comparison dendrogram for linkage using two methods
I can't understand what do you mean by two methods?
@@AGRONInfoTech I mean my tanglegram function is not working. What to do?
What error is displayed? Share me your code and data file at agron.infotech@gmail.com
@@AGRONInfoTech Could not find function tanglegram
@@MandeepSingh-rj5wi You need to first install package "dendextend" then load this package and write tanglegram() function. I hope this will work.
Thank you very much dear! Can I ask you inbox please!?
You can send me email at agron.infotech@gmail.com
@@AGRONInfoTech see inbox please!!
I have replied to your question. See inbox please. Hope this will be helpful for you.
@@AGRONInfoTech Dear Farhan,I did it with your instruction and method, thank you very much!!
Can I get this script via mail?
You can download it from the link given in description. Share your email address if you want to get through email.
@@AGRONInfoTech
mahmoud.biotech@azhar.edu.eg
See inbox
@@AGRONInfoTech
Thank you very much, I received this is tremendous tools. Excellent work my bro.
Very nice presentation
Thank you