Introduction to Statistics..What are they? And, How Do I Know Which One to Choose?

HTML-код
- Опубликовано: 15 июл 2024
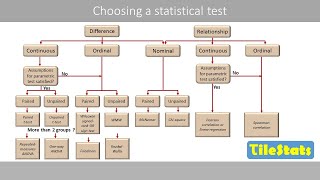
- This tutorial provides an overview of statistical analyses in the social sciences. It distinguishes between descriptive and inferential statistics, discusses factors for choosing an analysis procedure, and identifies the difference between parametric and nonparametric procedures.


This video was a blessing! You covered this topic in forty minutes versus reading four chapters of my text! I actually get it now! Thank you!
Last week if my course and if only they gave me as good of a run down as this I think I would not have felt like I was walking in the dark the whole time!
Thanks. Great job! I so appreciate this video!!!!!!!!
After reviewing several videos, pdfs, and a few text books, your video really helped clarify which statistical analysis to use for my research. Thank you!
+Beth Villarreal Beth, Thank you for your kind comment.
A VERY CLEAR AND EASY TO UNDERSTAND THE TOPIC. THE TEACHING HAS A COHERENCE OR SYSTEMATIC AND DETAILED. THANK YOU AND MORE POWER TO SHARE YOUR KNOWLEDGE.
This is very descriptive and precise. Thank you for sharing this information.
Thank you so much for this wonderful tutorial. God Bless!!
Duane, I am glad to here that this tutorial was helpful.
This video is a valuable resource that I will use for reference and as a guide while working on my statistical data analysis.
very insightful indeed, it made Research design looks quite simple
Excellent presentation and analysis. This is very helpful.
Thank you a lot! This really helped! If only I have seen this video before my midterm... I don't understand people who complained about the audience. This video is very informative but if you are looking for much more basic information you should try to find another video. This is definetly an introduction however you better have some basic understanding of statistics in order to understand it. Thank you a lot! You saved my final paper :)
This video is a pure gem!!!! you literally saved me. thank you !!!!!
This has been extremely useful in clarifying the applications of statistical methods. Thank you!
Very well prepared; all inclusive:) Thank you!
I am so thankful for this tutorial! Thank you so much for making it. I am really trying to understand the statistical analysis process and this is great! Good work!
+Tanya Vaughn Thank you for the kind words.
+Tanya Vaughn Yessssssss i so agree with u. The Doctoral Journey thank u very very very very much.
This tutorial was very helpful and i have just started a youtube channel talking about these things and I an inspired and learning a lot
you are an amazing teacher of applied statistics. I am doing applied biostatistics.
Thanks so much for the wonderful lecture in this course .
keep it up madam .
Content is well organized and very accurate. Projection is very clear. Thank you very much.
very thankful for this. I understand a lot more.
Thank you very much for explaining very clear 🤗🤗🤗 You help me from keep drowning out of confusion
thanyou for this tutorial you helped me a lot.
Really amazing voice. Perfect speed. Very helpful video and the channel!
Thank you so much!!! the video is informative and easy to understand the basics!!! Keep it up and appreciate for your efforts!!
Thanks for sharing :) Very well done and very well explained!
This is so clear and easy to understand. Thank you! :-) And your voice is so pleasant to listen to
Good crisp presentation . Useful to every researcher.
Thank you very much. so simple and clear. You really helped me.
The Doctoral Journey, this video is pretty useful! Thanks for sharing. Could you provide the entire references used during the presentation? Best Regards!
Excellent video. Thank you!
I really like your video from S. Korea!!!
very informative, good quality orientation, Thank you so much.
+RKNACHU BOWENPALLY Thank you
Thank you! This is most helpful ...
Very informative well analyzed good teaching
Thanks madam. .very helpful and informative video..
Thank you Mam! This is so detailed and informative.
Very good intro! Thanks
The goal of statistical analysis is to identify trends. There are five steps of statistical analysis: 1. Describe the nature of the data to be analyzed. 2. Explore the relation of the data to the underlying population. 3. Create a model to summarize understanding of how the data relates to the underlying population. 4. Prove (or disprove) the validity of the model. 5. Employ predictive analytics to run scenarios that will help guide future actions.
sabrina run
Thanks for this! :)
Thank you for the video. It's very helpful.
+sevaan simon I am glad to hear that this tutorial was helpful.
Thank you! Thank you ! Thank you!!!
I have compre exam tomorrow. Thank you for this!
Great Video. Exactly what I was looking for to get an overall summary. Spelling "Casual" should be changed to "causal" throughout.
give us more statistics. great job.
Thank you
good video and helofull
Thank you loads!
Your voice is like a lullaby to my ears
i just stumbled across this video and stayed kinda for that too
Thank you so much for the clear and detailed explanation
+Susan Mercado You are welcome.
Cool video
This is wonderful work....
+Lubega Samuel K Thank you.
Very useful talk.
very informative! not easy to catch up with the speed of the video, feel much better when pause on each slides and read the key points before listening.
Thank you! Been so frustrated and after watching this I understand a lot more!
Jack Riddell You're welcome! That's great.
Really thank you for the video. Would you help me with research in social psychology by recommending the best suitable title for the research and which way may easily will help me in this regard. Thank you for your respond
+ADA ALTAYE I really like Kazdin's book for research design.
Very helpful.... Thnx☺
Thank you for sharing, i love it. Would you like to recommend the title and writer of the books about statistics. I need learn more about it. Thank you.
Thanks you for this, it was very helpful, but I think you should speak a little bit slower.
Thank you so much
it was really helpful...thank you so much
+Omid Dianat Thank you.
Excellent tutorial. Well organized, progressed logically, covering relevant and basic information in areas I needed clarification. Thank you!
Thank you ❤
Thanks for the great videos..
Trio Wekwek You're very welcome.
The Doctoral Journey
Thanks.
Great!
thanks, at least I got an idea
Thank you so much! Very helpful to get me started on my doctoral journey! The pace was suitable for me : )
thank you
Campbell and Stanley made easy!!!
Thankyou Maam !!! You have cleared all my doubts in this subject.
+Sania Uwaiz I am happy to her that this tutorial provided clarity on the subject.
what books would you suggest for someone trying to start from scratch?
Hi. My topic is on A Study of Budget Slack and the Influence of Budget
Participation on Budget Slack. My research objectives are to study the
relationship between budget participation, procedural fairness,
distributive fairness, trust, goal commitment and manager's propensity
to create slack, to investigate the relationship between budget
participation on budget slack, to study the impacts of budgetary slack
to companies' managerial performance and to determine the effectiveness
of budget participation on managerial performance. I am using
questionnaire of 7-point Likert Scale from 1- Strongly disagree to 7-
Strongly agree for data collection. For budget participation, my
questionnaire has 6 questions of Likert Scale type. Should I use mean or
median to combine the 6 questions of budget participation into one item
of one value for budget participation in SPSS? Budget participation is
the independent variable. The mediating variables are procedural
fairness, distributive fairness, trust, goal commitment. The dependent
variable is budget slack. I would like to test the reliability of the
data using Cronbach alpha. I would like to use Pearson correlation to
study the relationship of budget participation, procedural fairness,
distributive fairness, trust, goal commitment towards budget slack. I
would like to use multiple regression for hypothesis testing. And I
would like to use factor analysis to test the 6 factors which are budget
participation, procedural fairness, distributive fairness, trust, goal
commitment and manager's propensity to create slack. My sample size is
154 respondents. The target population is on managers from small and
medium companies (SMEs). Am I on the right track for my statistical
tests? Any suitable recommendations of statistical tests for my
research? Thanks.
+sciencegalxx Your study sounds interesting. Providing feedback and recommendation on your direction and appropriate analysis takes an in depth understanding of your variable and design. Correlation analyses, namely bivariate, can be useful in examining the relationship between two variables. If you desire to understand the relationship among multiple variables, I caution you against the use of multiple bivariate analyses as it can increase error. Consider multivariate analyses to address this.
Thanks
thanks
One way repeated measure anova is the same of two way anova ?
Hi pls i need help! I'm working on a research that focuses on the views of male and female employees concerning salary and fringe benefits and i dont know how i should analyse the data i have collected. Although i have been using the rank order to i just dont know how to continue. Please help am also to find the difference in opinion of both parties as my hypothesis
This video just saved my life!! So helpful!
Hello. I am struggling with what statistics to use. I have a small sample chosen through non-probability sampling. One of my hypotheses is to test the significant difference of the variables with age, gender etc. The other is to test the relationship of the two variables. Help me please, Need it badly. Thanks
excelent video.
Estimated. that reference books recommend to identify the types of post hoc for nonparametric analysis. Or if this can recommend others as Nemenyi test for post hoc analysis. Thanks for your attention
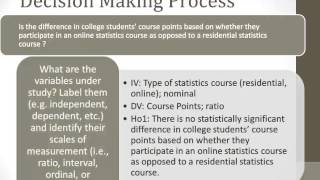
Hi, referring to the VDO @ 23.0min., I think it is not correct to say that in Education research there is an exception regrading Ordinal data and Interval data. If the data, in nature has no property of interval scale then it should be treated as one, no exception.
Holy Crap! I have to take a statistics course as a prerequisite for my Master's of marriage and family therapy. I didn't take it in undergrad. I just watched this entire lecture and this stuff is like greek to me. I am going to be so stressed out with this class. I get how it can be used for sample studies in marriage counseling, but I am NOT looking forward to having to learn this stuff. :(
I need data analysis statistics
Please change slides to indicate *Causal Comparisons, not *Casual
Great information however, the constant smacking before each sentence was distracting.
Who is your audience?
In the beginning you mention that you will rely upon a specific text reference for the factors for choosing a statistical method. I didn't hear it quite well, is this 'Warner'? Can you please give the full reference? Thx!
lower voice and slower speech would enhance your "video"....tremendously....!
very basic
wish you talked a little bit slower, but thank you anyways!
mau tidur
I must say teacher like you must really rethink your teaching strategy. It seems that you are participating in a academic Olympiad and you want to set a record by finishing lot of things within the short span of time. I had teachers like you who taught maths and stats in my school and university. I started disliking the subject than appreciating the subject. I can understand if you are asked to make this presentation for a TED talk with the time limit of 15 minutes. I do understand the concern of teachers who are forced to finish their teaching race within the permitted class hours and course period. But in a platform like youtube you can be slow enough to make sense you points to larger audience. People like me search for other teachers like you outside our conventional educational system because we expect something different from our regular teachers. But the story is same. ....
+Manoj Joseph I would normally agree, but this is YT and sometimes, you just want a video as fast and short as possible to scan through it and pick up those 15-20 seconds you needed and then listen to them over and over and google the rest. This method of speeding things up has made it a lot easier for me to research stuff for my thesis. Its also great for webminars on the side. The most annoying e-learnings for me are the ones where what is being said is not written down on the slides/video in at least keywords, because it ameks it harder to skip through and find the 5 mins you need. If this was her normal speed for a 45 min class I would agree its too fast. But for YT speed works great for me.
this whole video is like one semester (12 weeks or some shit) compiled into 40 minutes. what do u expect ? enroll into a college maybe cuz youtube ain’t gonna teach u shit for free
Agreed 100% ... you can't get better than this for free... appreciate.... the good efforts
There are many teachers out there spoon feed people knowledge without giving them overview of how all pieces interrelated and differed with each other. If you're looking for kindergarten spoon feeding, there are plenty of material out there, this is for doctoral candidates who seek to integrate knowledge and this is the best teaching ever.
I am beginner in stastices. Nothing was helpful . Your presentation lacks small & short examples which could have created better understanding of concepts.
+Syed Sikandar The intended audience for this tutorial is graduate/ doctoral students (i.e., doctoral journey) who have a foundation in statistics. It is assumed you have a basic understanding, and this will be a refreshers. I recommend finding RUclips videos for beginners if this is your developmental level.
+The Doctoral Journey I AM A POST GRADUATE STUDENT. Still found difficuty to understand. Anyway! to avoid confusion among beginners, Please rename the title of the video as '' Introduction to statistices for doctoral level '' . Finally a complimentation for your great voice & accent. Thank you
thanks