The video is greatly appreciated, I would just like to emphasize on the fact that the change is only in the variability of our U. We see a boost in R^2 because we're using this new regression model >> Y = B(0) + B(1)*X(i) + F(i) + u >> Naturally since now we have the new expression F(i) the variability is reduced because in our old model we had Y = B(0) + B(1)*X(i) + u without the F(i) and now the U of the original model equals = u (original) + a customized mistake margin for each group which is F(i). So naturally because now U is smaller than the U before since we added this custom mistake for each group, it will cover more of the variability of the model.
Great video, many thanks! Two questions: 1) The manually implemented within estimator has a different t-statistic than the others. It may be worth mentioning that these reported t-statistics are wrong. In his panel-data-book (2010, p. 306), Wooldridge explains that one has to correct this by multiplying with the factor ((NT-K)/(N(T-1)-K))^1/2. I tried it, and the corrected t-stat I get in "reg" is very similar but not exactly the one that "xtreg" shows. Is this factor affected by survey-design (weights, clusters, strata) or by having an unbalanced panel, and if so, do you know or have a reference on how to adjust for that to get the correct t-stats? 2) It seems one can do the easy manual implementation of the within estimation with any estimation method, e.g. sureg, reg3, gmm,... (this most probably excludes probit, tobit and other non-linear models, for which FE is often not applicable anyways). This just by using demeaned versions of the variable and correcting the reported t-statistics with the abovementioned factor. Is that so?
I mainly show the "manual" implementation for pedagogical purposes. I think it's important to see what's going on behind the scenes when using the commands. The method I used assumes you have a balanced panel. Of course, it's possible to redesign the method to fit an unbalanced panel, but it gets more complex. I haven't done it with other estimation methods, so can't really comment on that.
Thank you so much for your clear explanation. I have a question regarding the coefficient of the year dummy variable. How do you interpret the coefficient? What does the coefficient of the year tell you regarding the impact on the dependent variable? Thank you in advance!
If it's positive, the dependent variable tends to be higher in that year, compared with the base year. If it's negative, the dependent variable tends to be lower in that year, compared with the base year. All while holding the other variables constant, as we always do.
Hey Sebastian, awesome video! Thank you so much. Now I understand the method itself but can you please please explain the coefficients? I don't know how to interpret "unemp" which is 2,218 after the fixed effects method. So what does only one number mean for so many cities? What is the interpretation here? Also from before (which was 0,4265).
This means that if unemployment goes up by 1 percentage point, we expect 2.218 more crimes per 1000 people in the city. This is an effect "on average." Not saying it would be 2.218 in every case, but that would be the expectation.
in the command xtset you use d87 as the time-variable. This is a dummy since the measurements in this dataset are taken at two time-points. But what is you have several time-points in which the data is collected (e.g. if a variable "survey_year" includes 2008 till 2015)?
thank you for you great video, if we have more than one independent variables, do we also gen all independent variable star by subtract the original value and the mean value and calculate the regression ?
Thanks so much! A quick Q: Instead of doing reg for dummy variables, is there a STATA command for xtreg that also illustrates the dummies in the regression table?
@@sebastianwaiecon Okay thanks. With "xtreg", I was planning to use robust model, meaning including .vce. Now with normal "reg" and dummies, how should I get robust SE ? With "newey" ?
Very helpful! What if my indep variables are a lot more than 2, let's say 15? Do i have to use the within estimator method with all the independent variables? I ask because you did it only with the dependent and the main independent variable.
You need to de-mean all variables, not just the main one of interest (other than the time dummies, as explained in the video). If you have a lot of variables, I would recommend using xtreg so you don't have to do it all yourself.
Hi, thank you for the video! May I know how do I create year-month * country fixed effect? My year-month variable is in '2010Jan' form, and i try to create by adding i.country*yearmonth, and no observation is produced. Thank you for your time!
Bare minimum, 4 observations to make the math work, but otherwise no minimum. More observations will provide more statistical power. See my video on difference in differences estimation.
Hi, when I try to perform panel regression using fixed effect on STATA with dummy variables, STATA "Omit" my variable in the result. It shows "omitted". How can I avoid that?
hi sebastian. thank you again for your very brief and excels explanation. i already download the data. however, the original dataset that available did not contain id variable to identify the city like you said. in this case or perhaps i face another same problem in the future, with what command to generate id variable based on the city? thank you. much bless to you
@@sebastianwaiecon hi thank you again. with what command exactly? i mean sometimes people using it just by "gen NewVarName=_n", but it wouldnt work due in this case the data appeared twice. can you write with what command? thank you
Heteroscedasticity-robust standard errors do not affect the R squared. While they are not the focus of this video, I do have a video on how they are calculated. While I usually do recommend using them, it's important to understand why you are doing what you are doing.
hi..i wanna ask, can we use fixed effect model for categorical data?..for example,one of my explanatory variable, educational level (0=no attending school, 1=up to elemantary school,..4=up to higher) . In 2000, the educational level of one people is "1", and in 2010, the educational level of the same people is "4"
One doubt. If we have a cross sectional data and there are around 6000 dummies for each village fixed effects. I ran it on STATA and the computation has been taking hours with many observations bring dropped with a note of prediction of failure correctly. What needs to be done in that case?
first of all, thanks for this interesting tutorial. I want your help please, what is the command in stata used to estimate the fixed effect model with SUR option to control for cross-section dependance.
For a student its very complex dataset, you could have used a proper panel data with a proper number of i and proper time period. You didn't use XT to make data panel. Could we use Fixed effect model in regress??
I show how to use xtset at 8:12. The purpose of the video is to show what the within estimator actually does before simply showing the xtreg command. By manipulating the data properly, you can do all of it just with the basic regress command.
I am trying to run the regression, whenever I include time dummy it ommits it due to collinearity. I am using a repeated cross section which I have got the mean of a survey response for regions in two time periods and regressing this against a continuous dependent variable
A common mistake is having a dummy for both time periods. You should only have one for the second period. If that's not the case, then you may have made a mistake creating your time dummy.
Thank you so much for your videos. I was wondering if this method is correct if I have cross-sectional data and not panel data? i.e I want to control for unobserved heterogeneity across cities. Can I use the dummy variable (by including a dummy for each city) / within estimator method?
@@sebastianwaiecon Thank you very much! Yes I have multiple observations per city (as in, each city is divided into a number of different geographical tracts). Therefore, I end up having say 5 observations for each city (at 5 different tracts within the city). Is this still possible/does it make sense to now add city dummies?
Hi! thanks for the video. I do have a doubt cause in this case it was a two-year variable. I am working now with a several year variable. How can I run the within transformation model with multiple years? would that change? Thankyou so much!
Hi can you make video on binary logistic and multinomial regression on fixed effect using panel data with some categorical independent variables with one IV has 2 levels (e.g gender having levels male and female) and other IV has more than 2 levels (e.g smoking status: past smoker, current smoker and no smoker where current and past smokers are mutually exclusive). Thanks for nice videos
Hello, If I am trying to use the fixed effect model to estimate the relationship between Per Capita Income of U.S. (Dependent Variable) and # of higher education degrees earned / total university patent granted as my independent variables; would this model work? I am only interested in United States alone.
What is your unit of observation? Each observation in panel data needs a cross-sectional unit (state or city perhaps?) and time (year, probably?). If you only have U.S. aggregated data, then you have a time series, not a panel. I have a video on that, as well.
Hey, this is super helpfull. I understand that you can use fixed effects for cities. But say I have a datasets with yearly data on travel between cities, how can I add fixed effects for these city pairs?, say like you want to fix for distance between 2 cities, or if there is an airport in both cities, how can I do this. Greatly appreciate if someone could help!
Basically the same idea as this example. You need to create a unique identifier for each city pair. For example, you could make a new variable where you concatenate the two city names together. Then use encode on that identifier (see my video on categorical data).
My time series video has a way to do this, but with panel it's a bit more involved. I assume you already have a year variable that goes something like 2001, 2002, 2003, etc. If doing time dummies, you don't need a t variable. You can just do i.year to create temporary dummies.
I don't typically use RE models, so I can't comment on that specifically. However, you can use heteroscedasticity robust standard errors with FE. See my video on robust standard errors for details.
6 лет назад
Hi! great video! Could you do a video for multidimensional panel with random effects?
No, degrees of freedom should be the same. You can see at 9:40 when I use xtreg, the F stat shows 44 degrees of freedom, which is the same as the dummy variable version. If you do the within estimator manually, you have to be careful and still subtract for what would have been the dummies.
@@sebastianwaiecon Thank you so much for the response, it is very helpful. Just one thing I do not understand is where the degrees of freedom are lost when doing the demeaned model, as the means of the variables already exist we are just calculating them? Whereas of course with the dummy variable model we are introducing new variables. Of course the time demeaned versions of variables are new variables themselves but since they could be written as (xbar_i minus x_it) I do not see why this has an impact. Thanks again, love the videos they've been a huge help. :)
Even though you don't have the actual dummies in there, you are still accounting for the same number of fixed effects. Since the regression results are mathematically identical, the degrees of freedom must also be the same.
I have a dataset with 5 years. As far as I can tell you're demeaning for the city FE, but controlling for year with the time dummy. What if I want to remove the year FE for more than one time period as well as the FE for the city?
Yo man I am testing synchronicity as a dep Var and have dummy as a ind var. The problem is that it gets ommited, even though thats the main variable I want to examine? Do you know what I should do know? Thanks alot
Could be that what is happening is that your dummy variable doesn't change over time, so it's getting differenced out by the fixed effects. It could also be you made a mistake creating the variable. Hard to give any more specific advice than that.
@@sebastianwaiecon Thank you. I'll surely watch. Can you suggest me some models that I can use for my regression analysis? I collected data for a single country for over a period of 10 years.
The basic options are discussed in the video. FDL, first differencing, and detrending are good places to start. That being said, a lot of people find pure time series somewhat unconvincing compared to panel. You might consider looking at multiple countries, if that's possible.
Hi! I have a question about STATA. In panel data modeling with fixed effects, I would like to know how to change what STATA controls (time or object). Thank you very much in advance.
@@sebastianwaiecon Thanks for answering. But I need to know how to choose between isolating time or isolating the object. That's what I still do not understand...
@@sebastianwaiecon So what is the default that Stata uses to run fixed effects: isolating time or isolating object? Is it possible to choose this in any configuration?
@@andrepbatista1 If I'm understanding you, you're asking about which fixed effects are used with the fe option? It's always cross-sectional units fixed effects. To get time effects, you need to add dummy variables for each time period. I'm not aware of a way to change that.
The dataset is the CRIME2 dataset that comes with Introductory Econometrics by Wooldridge. You can find these datasets fairly easily with a Google search. I added the city ID variable myself.
Can someone help me on stata i need write my thesis? Pls it is very urgent. I get statistically insignificant results after fixed regression analysis. What do i need to do?
Time dummies are variables with values 0 or 1, indicating observations occurred in a given time period. See my video on categorical data for how dummies generally work. The i.year structure is the typical way to do it.
@@sebastianwaiecon Perfect, thanks a lot! If might ask one more question: I have panel data for which I want to analyse the correlation between firm performance and CEO turnover (60 firms and 6 years). So far, I've used xtreg with fe and it worked out fine. Now, the data set also includes a categorical variable indicating which region each firm is located in and there is also a variable for company size (both time-invariant). I would like to find out how the region and firmsize moderate the performance turnover relationship. Is there a model where I can include those 2 variables or should I rather conduct different regressions for different sub samples (e.g. one for small firms and one for big firms)? Thank you in advance, much appreciated!
@@Jaja1499 FE will always wipe out any time-invariant variables, but it wouldn't do that for interaction terms with other variables. There might be some specialized models one could also use, but I haven't done that before.
@@sebastianwaiecon in a case where you have more than two years, say you have 5 years time period. is creating a dummy still applicable, seeing that you only assign either a 0 or a 1?.... how would you have generated you d87 if time periods were more than two years?
@@sebastianwaiecon Hi again. Does this sound right to you? I changed my 'years' variable from int to str, then turned it into a category. I then input 'reg oldage_pmp Welfare_regime_type i.YEAR'. If this is right, year will now be controlled for while the variance caused by the other IV is measured, and then the impact of each separate year on the DV will be measured as well? Thank you for your response :)
@@sebastianwaiecon Thanks for your reply! So what you mean is that when we use xtset, that will only detect the cross section differences as the fixed effect right? If we want to use an additional fixed effect with time, then we have to include a dummy.


Thank you Sebastian, very smart, short and clear lecture. In a few minutes you make me understand what i didn’t in years. 😂
thanks man i was struggling from many hour this video was a life saver for Me.
hi. i need help
This video was so nice! Taught me all I struggled to learn in class during 2 hours in 13.40 minutes
Your video was the best ever. you have made a summary of 2 chapters in 13 minutes. so useful and I do appreciate it.
your explanations are very clear although I'm a French student I needed this course cause i am working on panel data for my thesis
thanks a lot Sir
thank you, finally understood how it works exactly
The video is greatly appreciated, I would just like to emphasize on the fact that the change is only in the variability of our U. We see a boost in R^2 because we're using this new regression model >> Y = B(0) + B(1)*X(i) + F(i) + u >> Naturally since now we have the new expression F(i) the variability is reduced because in our old model we had Y = B(0) + B(1)*X(i) + u without the F(i) and now the U of the original model equals = u (original) + a customized mistake margin for each group which is F(i). So naturally because now U is smaller than the U before since we added this custom mistake for each group, it will cover more of the variability of the model.
Thank you so much for these videos! They have been invaluable in helping me study for my econometrics exam.
best video I have ever seen on the topic, and I have seen quite a few. thank you!
Wow! So insightful. You saved my project, thanks.
Thanks!! It is a really great and clear explanation of fixed effects.
Thanks for the video. Your explanations are really clear.
Awesome! So clear and practical. Thanks!
Could you please come teach STATA to us public health kids?? This is so great, thank you!!!!!
Why do we use reg command with FD instead of xtreg (as it is done with FE)? Thank you
If you use FD, you have differenced out the fixed effects, so xtreg is unnecessary. They are two different methods to accomplish the same goal.
Excellent video, very useful indeed
Man this is gold!
Tmj irmão, salvou aqui em micro4 familia!!!
Great video, many thanks! Two questions:
1) The manually implemented within estimator has a different t-statistic than the others. It may be worth mentioning that these reported t-statistics are wrong. In his panel-data-book (2010, p. 306), Wooldridge explains that one has to correct this by multiplying with the factor ((NT-K)/(N(T-1)-K))^1/2. I tried it, and the corrected t-stat I get in "reg" is very similar but not exactly the one that "xtreg" shows. Is this factor affected by survey-design (weights, clusters, strata) or by having an unbalanced panel, and if so, do you know or have a reference on how to adjust for that to get the correct t-stats?
2) It seems one can do the easy manual implementation of the within estimation with any estimation method, e.g. sureg, reg3, gmm,... (this most probably excludes probit, tobit and other non-linear models, for which FE is often not applicable anyways). This just by using demeaned versions of the variable and correcting the reported t-statistics with the abovementioned factor. Is that so?
I mainly show the "manual" implementation for pedagogical purposes. I think it's important to see what's going on behind the scenes when using the commands. The method I used assumes you have a balanced panel. Of course, it's possible to redesign the method to fit an unbalanced panel, but it gets more complex. I haven't done it with other estimation methods, so can't really comment on that.
Thank you for this video. It's really help me.
It's really helpful.. thank you for your information...
Great job. Actually, same data can be analyzed in with xtmixed, where id's can be considered as random effects.
Thank you so much for your clear explanation. I have a question regarding the coefficient of the year dummy variable. How do you interpret the coefficient? What does the coefficient of the year tell you regarding the impact on the dependent variable? Thank you in advance!
If it's positive, the dependent variable tends to be higher in that year, compared with the base year. If it's negative, the dependent variable tends to be lower in that year, compared with the base year. All while holding the other variables constant, as we always do.
Hey Sebastian, awesome video! Thank you so much. Now I understand the method itself but can you please please explain the coefficients? I don't know how to interpret "unemp" which is 2,218 after the fixed effects method. So what does only one number mean for so many cities? What is the interpretation here? Also from before (which was 0,4265).
This means that if unemployment goes up by 1 percentage point, we expect 2.218 more crimes per 1000 people in the city. This is an effect "on average." Not saying it would be 2.218 in every case, but that would be the expectation.
Thank you for the video. Quick question: If I'm using DID model do I run FE for all the regression models or just the base model?
I would recommend taking a look at my diff-in-diff video.
in the command xtset you use d87 as the time-variable. This is a dummy since the measurements in this dataset are taken at two time-points. But what is you have several time-points in which the data is collected (e.g. if a variable "survey_year" includes 2008 till 2015)?
Use i.survey_year to include temporary time dummies in your regression.
thank you for you great video, if we have more than one independent variables, do we also gen all independent variable star by subtract the original value and the mean value and calculate the regression ?
Yes, you would do that. In most cases, though, I recommend just using the xtreg command to get it done.
Clear
Thanks so much! A quick Q: Instead of doing reg for dummy variables, is there a STATA command for xtreg that also illustrates the dummies in the regression table?
If you want to see all the dummies you do need to use "reg" instead of "xtreg."
@@sebastianwaiecon Okay thanks. With "xtreg", I was planning to use robust model, meaning including .vce. Now with normal "reg" and dummies, how should I get robust SE ? With "newey" ?
Just "robust" will get it done.
hey, thank you for the video. Would you please explain me briefly industry fixed effect ? what should I do exactly ? Thank you.
Very helpful! What if my indep variables are a lot more than 2, let's say 15? Do i have to use the within estimator method with all the independent variables? I ask because you did it only with the dependent and the main independent variable.
You need to de-mean all variables, not just the main one of interest (other than the time dummies, as explained in the video). If you have a lot of variables, I would recommend using xtreg so you don't have to do it all yourself.
Hi, thank you for the video! May I know how do I create year-month * country fixed effect? My year-month variable is in '2010Jan' form, and i try to create by adding i.country*yearmonth, and no observation is produced. Thank you for your time!
See this article: www.stata.com/features/overview/factor-variables/
Thanks. Please can you show. What should be the minimum observation required FOR DID
Bare minimum, 4 observations to make the math work, but otherwise no minimum. More observations will provide more statistical power. See my video on difference in differences estimation.
Hi, when I try to perform panel regression using fixed effect on STATA with dummy variables, STATA "Omit" my variable in the result. It shows "omitted". How can I avoid that?
hi sebastian. thank you again for your very brief and excels explanation. i already download the data. however, the original dataset that available did not contain id variable to identify the city like you said. in this case or perhaps i face another same problem in the future, with what command to generate id variable based on the city? thank you. much bless to you
I created the ID variable based on the "area" variable, since that is unique to each city but doesn't change over time.
@@sebastianwaiecon hi thank you again. with what command exactly? i mean sometimes people using it just by "gen NewVarName=_n", but it wouldnt work due in this case the data appeared twice.
can you write with what command? thank you
Aren't you supposed to put option robust (, r) behind all your regressions?? Putting robust will affect your R squared value.
Heteroscedasticity-robust standard errors do not affect the R squared. While they are not the focus of this video, I do have a video on how they are calculated. While I usually do recommend using them, it's important to understand why you are doing what you are doing.
hi..i wanna ask, can we use fixed effect model for categorical data?..for example,one of my explanatory variable, educational level (0=no attending school, 1=up to elemantary school,..4=up to higher) . In 2000, the educational level of one people is "1", and in 2010, the educational level of the same people is "4"
Yes. See my video on categorical variables for how to use them: ruclips.net/video/QN7u-ZBHqic/видео.html
can anyone explain me whats the importance of year fixed effect? why we need it and what we find by using it?
Thank you
One doubt. If we have a cross sectional data and there are around 6000 dummies for each village fixed effects. I ran it on STATA and the computation has been taking hours with many observations bring dropped with a note of prediction of failure correctly. What needs to be done in that case?
You can't do fixed effects with cross sectional data. This is for panel data.
first of all, thanks for this interesting tutorial. I want your help please, what is the command in stata used to estimate the fixed effect model with SUR option to control for cross-section dependance.
Consider looking into the sureg command.
For a student its very complex dataset, you could have used a proper panel data with a proper number of i and proper time period. You didn't use XT to make data panel. Could we use Fixed effect model in regress??
I show how to use xtset at 8:12. The purpose of the video is to show what the within estimator actually does before simply showing the xtreg command. By manipulating the data properly, you can do all of it just with the basic regress command.
SebastianWaiEcon OK sir. Thank you
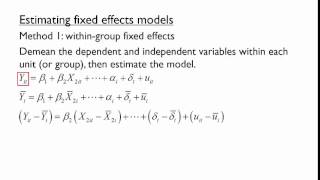
5:07 within group estimator
I am trying to run the regression, whenever I include time dummy it ommits it due to collinearity. I am using a repeated cross section which I have got the mean of a survey response for regions in two time periods and regressing this against a continuous dependent variable
A common mistake is having a dummy for both time periods. You should only have one for the second period. If that's not the case, then you may have made a mistake creating your time dummy.
Hello, i would like to know if its necessary to use vce(robust) when using within estimator, i mean xtreg...fe, vce(robust)
Thank you so much for your videos. I was wondering if this method is correct if I have cross-sectional data and not panel data? i.e I want to control for unobserved heterogeneity across cities. Can I use the dummy variable (by including a dummy for each city) / within estimator method?
If you have multiple observations per city, you can use dummy variables for each city. If you only have one observation per city, you can't.
@@sebastianwaiecon Thank you very much! Yes I have multiple observations per city (as in, each city is divided into a number of different geographical tracts). Therefore, I end up having say 5 observations for each city (at 5 different tracts within the city). Is this still possible/does it make sense to now add city dummies?
There is nothing theoretically preventing doing so.
How to check whether we need to add period dummies Or just period as variable
If you think there is a linear time trend, you could use the period as a variable. Otherwise, you would want dummies.
Hi! thanks for the video. I do have a doubt cause in this case it was a two-year variable. I am working now with a several year variable. How can I run the within transformation model with multiple years? would that change?
Thankyou so much!
Select a base year and include dummy variables for all the other years. You can use the i. structure to get that done.
How can we interpret the values for sigma_u and sigma_e and rho?
Hi can you make video on binary logistic and multinomial regression on fixed effect using panel data with some categorical independent variables with one IV has 2 levels (e.g gender having levels male and female) and other IV has more than 2 levels (e.g smoking status: past smoker, current smoker and no smoker where current and past smokers are mutually exclusive). Thanks for nice videos
Hey! I've got a question regarding the program. I know xtset is similar to tsset. Do you any difference between them both?
Thanks in advance and thanks for the video!
Hello, everytime I get the error repeated time values within panel. How can I fix this?
Hello, If I am trying to use the fixed effect model to estimate the relationship between Per Capita Income of U.S. (Dependent Variable) and # of higher education degrees earned / total university patent granted as my independent variables; would this model work? I am only interested in United States alone.
What is your unit of observation? Each observation in panel data needs a cross-sectional unit (state or city perhaps?) and time (year, probably?). If you only have U.S. aggregated data, then you have a time series, not a panel. I have a video on that, as well.
So I have more than two time periods. How exactly did you construct this t variable? I’m sorry but you did not clarify this at all
Hi, how are you able to use d87 as the time variable without getting the error message "repeated time values within panel"? Thanks!
It sounds like you may have used tsset instead of xtset after you loaded your data.
Hey, this is super helpfull. I understand that you can use fixed effects for cities. But say I have a datasets with yearly data on travel between cities, how can I add fixed effects for these city pairs?, say like you want to fix for distance between 2 cities, or if there is an airport in both cities, how can I do this. Greatly appreciate if someone could help!
Basically the same idea as this example. You need to create a unique identifier for each city pair. For example, you could make a new variable where you concatenate the two city names together. Then use encode on that identifier (see my video on categorical data).
Nice video. How to construct a t variable that goes 1,2,3,4.. for multiple years?
My time series video has a way to do this, but with panel it's a bit more involved. I assume you already have a year variable that goes something like 2001, 2002, 2003, etc. If doing time dummies, you don't need a t variable. You can just do i.year to create temporary dummies.
SebastianWaiEcon thanks I got it.
Please can I apply same to my RE model, if my Hausman test results allows me to pick RE model... I wanna eliminate heteroskedasticity
I don't typically use RE models, so I can't comment on that specifically. However, you can use heteroscedasticity robust standard errors with FE. See my video on robust standard errors for details.
Hi! great video! Could you do a video for multidimensional panel with random effects?
No plans to do that at the moment, but the xtreg documentation should have what you need.
Thanks. BTW how do you implement a diff-in-diff analysis with panel data in STATA?
I will be doing a video on that soon.
@@sebastianwaiecon is the video already available? I did not find it on RUclips
@@thomasbauer3742 ruclips.net/video/K0drFLzrI3I/видео.html
tHANK YOU, how can i use to data in lecture Sir ? Thank you
are the degrees of freedom different if it is implemented via dummy variables versus demeaned values? would really appreciate an answer.
No, degrees of freedom should be the same. You can see at 9:40 when I use xtreg, the F stat shows 44 degrees of freedom, which is the same as the dummy variable version. If you do the within estimator manually, you have to be careful and still subtract for what would have been the dummies.
@@sebastianwaiecon Thank you so much for the response, it is very helpful. Just one thing I do not understand is where the degrees of freedom are lost when doing the demeaned model, as the means of the variables already exist we are just calculating them? Whereas of course with the dummy variable model we are introducing new variables.
Of course the time demeaned versions of variables are new variables themselves but since they could be written as (xbar_i minus x_it) I do not see why this has an impact.
Thanks again, love the videos they've been a huge help. :)
Even though you don't have the actual dummies in there, you are still accounting for the same number of fixed effects. Since the regression results are mathematically identical, the degrees of freedom must also be the same.
@@sebastianwaiecon ahah I'm still not sure I quite get it but I suppose that does make sense. Thanks a lot :)
Hi Sebastian, any insight on how to demean the data for year and city fixed effects?
This is done in the video starting at about 4:00.
I have a dataset with 5 years. As far as I can tell you're demeaning for the city FE, but controlling for year with the time dummy. What if I want to remove the year FE for more than one time period as well as the FE for the city?
I've never heard of that being done. I messed around with it a bit, and I don't think you can eliminate dummies for both.
Yo man I am testing synchronicity as a dep Var and have dummy as a ind var. The problem is that it gets ommited, even though thats the main variable I want to examine? Do you know what I should do know? Thanks alot
Could be that what is happening is that your dummy variable doesn't change over time, so it's getting differenced out by the fixed effects. It could also be you made a mistake creating the variable. Hard to give any more specific advice than that.
@@sebastianwaiecon thanks a lot for the help :)
i'm doing a fixed effect in Stata with time series data but I'm not able to do it. Do you know what's the problem?
You can't do fixed effects with time series data, since there is only one cross-sectional unit. You may want to look at my video on time series data.
@@sebastianwaiecon Thank you. I'll surely watch. Can you suggest me some models that I can use for my regression analysis? I collected data for a single country for over a period of 10 years.
The basic options are discussed in the video. FDL, first differencing, and detrending are good places to start. That being said, a lot of people find pure time series somewhat unconvincing compared to panel. You might consider looking at multiple countries, if that's possible.
Hi! I have a question about STATA. In panel data modeling with fixed effects, I would like to know how to change what STATA controls (time or object). Thank you very much in advance.
You want to use the xtset command. I show this at about 8:10.
@@sebastianwaiecon Thanks for answering. But I need to know how to choose between isolating time or isolating the object. That's what I still do not understand...
@@andrepbatista1 Sorry, I don't understand the question, then.
@@sebastianwaiecon So what is the default that Stata uses to run fixed effects: isolating time or isolating object? Is it possible to choose this in any configuration?
@@andrepbatista1 If I'm understanding you, you're asking about which fixed effects are used with the fe option? It's always cross-sectional units fixed effects. To get time effects, you need to add dummy variables for each time period. I'm not aware of a way to change that.
Thank you so much! could someone please tell me where I can find and download the data that you used for example if I want to practice it?
The dataset is the CRIME2 dataset that comes with Introductory Econometrics by Wooldridge. You can find these datasets fairly easily with a Google search. I added the city ID variable myself.
@@sebastianwaiecon thank you!
@@sebastianwaiecon Can you send us the download for your edited dataset?
Where can I find this dataset to follow through
Can someone help me on stata i need write my thesis? Pls it is very urgent. I get statistically insignificant results after fixed regression analysis. What do i need to do?
Hey! Thanks for the video. What exactly are time dummies? How do I create those in stata? i.year?
Time dummies are variables with values 0 or 1, indicating observations occurred in a given time period. See my video on categorical data for how dummies generally work. The i.year structure is the typical way to do it.
@@sebastianwaiecon Perfect, thanks a lot! If might ask one more question: I have panel data for which I want to analyse the correlation between firm performance and CEO turnover (60 firms and 6 years). So far, I've used xtreg with fe and it worked out fine. Now, the data set also includes a categorical variable indicating which region each firm is located in and there is also a variable for company size (both time-invariant). I would like to find out how the region and firmsize moderate the performance turnover relationship. Is there a model where I can include those 2 variables or should I rather conduct different regressions for different sub samples (e.g. one for small firms and one for big firms)? Thank you in advance, much appreciated!
@@Jaja1499 FE will always wipe out any time-invariant variables, but it wouldn't do that for interaction terms with other variables. There might be some specialized models one could also use, but I haven't done that before.
@@sebastianwaiecon Thank you
@@sebastianwaiecon in a case where you have more than two years, say you have 5 years time period. is creating a dummy still applicable, seeing that you only assign either a 0 or a 1?.... how would you have generated you d87 if time periods were more than two years?
How do you do this when you have datat from every year from 1960 - 2020?
Take a look at my video on categorical data. You need to include a dummy variable for each year (other than the base year).
@@sebastianwaiecon Thanks, will do :)
@@sebastianwaiecon Hi again. Does this sound right to you? I changed my 'years' variable from int to str, then turned it into a category. I then input 'reg oldage_pmp Welfare_regime_type i.YEAR'. If this is right, year will now be controlled for while the variance caused by the other IV is measured, and then the impact of each separate year on the DV will be measured as well? Thank you for your response :)
12:!6 u said u were missing the first variable yes i get it but why u miss the all the rest 45?
You miss the first period observation for every cross-sectional unit. There are 46 cities in the data.
when you use xtset id d87 and run the model with. ,fe. at the very end, is that using time and id fixed effects? or is it just the id?..
Both. The time fixed effect is included using the d87 dummy variable.
@@sebastianwaiecon Thanks for your reply! So what you mean is that when we use xtset, that will only detect the cross section differences as the fixed effect right? If we want to use an additional fixed effect with time, then we have to include a dummy.
That is correct.
Could you attach the data to exercise please
The dataset is crime2.dta from the Wooldridge textbook. It can be found many places online. See the pinned comment for more details.
How do we run a fixed effetcs model with 10 years?
You need dummy variables for years. Look for my video on categorical data for help.
@@sebastianwaiecon thank you a lot.
if i could kiss you i would. haha really, thank you so much, you helped a lot!
i need help
where can I download the data set
Dataset is CRIME2.dta from the Wooldridge book. You can get them many places online.
@@sebastianwaiecon can you help me to find excel data set from internet
it is too complicate for beginner.
poor quality