Qualitative Data - Why ? What? || Nominal Data || Ordinal Data || Statistics for Beginners

HTML-код
- Опубликовано: 10 окт 2024
- This video will discuss WHAT, WHY and TYPES of QUALITATIVE DATA with fun animation and examples.
Please subscribe to our channel for more such videos - / @learningchampion
•••••••••••••••••••••••••••••••••••••••••••••••••••
Video Covers:
-- Why study data types?
-- Different types of data in Statistics
-- Qualitative Data
-- Quantitative data
-- Types of Qualitative data
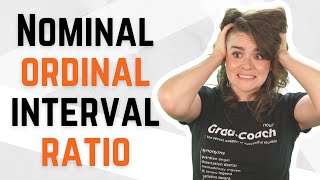
-- Nominal data
-- Ordinal Data
•••••••••••••••••••••••••••••••••••••••••••••••••••
Watch the full Statistics for Beginner Series here:
• Statistics for Beginners
•••••••••••••••••••••••••••••••••••••••••••••••••••
Useful Links:
-- Python Programming: A Beginner's Guide to Learn Python - amzn.to/465sgau
-- Automate the Boring Stuff with Python, 2: Practical Programming for Total Beginners - amzn.to/3t52jsP
-- Python All-in-One for Dummies - amzn.to/3Pvcqi9
-- Python: The Complete Reference - amzn.to/3rgw5KR
-- Data Science From Scratch - amzn.to/3LyCkAz
-- Python Data Science Handbook: Essential Tools for Working with Data - amzn.to/3ZvUKrt
-- Practical Statistics for Data Scientists - amzn.to/3t6UuD7
-- Apple 2023 MacBook Air - amzn.to/3ZvxR7o
-- Apple 2022 MacBook Pro - amzn.to/3ENhBVV
-- Acer Nitro V Gaming Laptop - amzn.to/3PBFW66
-- HP USB Wireless Mouse - amzn.to/46pwWaD
-- Lenovo Wireless Compact Mouse - amzn.to/456ijIe
-- Portronics Wireless Optical Mouse - amzn.to/3t6UL97
-- Mouse Pad Large/Desk Mat - amzn.to/3EQg3dG
-- Gel Mouse pad with Wrist Rest - amzn.to/3EWcgvb
-- Vegan Leather Mouse Pad with Wrist Rest - amzn.to/3EPyK13
-- uni-ball Eye 0.7mm Roller Ball Pen - amzn.to/3LAHQCJ
-- Reynolds TRIMAX - amzn.to/46l1V7L
-- Pentonic Ball Pen - amzn.to/3ZvhZl7
-- Hauser Sonic 0.55mm Gel Pen - amzn.to/3ZvynlQ
-- STABILO Fineliner Pen point - amzn.to/3PmtvuE
-- To Do List Acrylic Board for Desk - amzn.to/3Lzz3AT
-- 2023 Undated Daily Planner/Journal/Schedule/To-Do List/Productivity Tracker/ Gratitude Journal/Mood Tracker for Wellness - amzn.to/3PQ9iin
-- Daily Planner and Journal - amzn.to/46oKnIe
-- To Do List Daily Planner Notepad A4 - amzn.to/3PuvIV1
-- Simple Planner: 12 Months Undated - amzn.to/46oRakS
-- Journal Diary - amzn.to/3PwIoui
-- Soft Cover 6 Subject Spiral Binding Notebook, Single Line - amzn.to/3RzwHpC
-- Hard Bound Notebook with Elastic Band Closure & Pen Loop - amzn.to/3rh9yxr
-- 5 Subject Notebook - amzn.to/3ENzG5U
-- Classic Notebook Checkered - amzn.to/3POxVff
-- Sticky Book Tabs Colorful Annotation Tabs - amzn.to/3POZSU4
-- Transparent Sticky Notes - amzn.to/3ZsqT2U
-- Pastel Sticky Notes Pad - amzn.to/3Zr9jfO
-- Post-it Super Sticky Notes - amzn.to/3PMRq7Z
•••••••••••••••••••••••••••••••••••••••••••••••••••
Music Used :
------------------------------
Tobu - Candyland [NCS Release] : • Video
------------------------------
•••••••••••••••••••••••••••••••••••••••••••••••••••
Keywords :
Machine Learning , Machine Learning Python , Machine Learning Tutorials , ML , Python Tutorial , Machine Learning with Python , Machine Learning tutorial for beginners , How to start Machine Learning , Basics of Machine Learning , ml , Machine learning with Python , Tips and tricks in Python , python programming , statistics for data science , statistics for 10 , 11 , 12 , what is statistics in math , mathematics , subject , what is statistics in English , what is statistics in economics , what is business Statistics , statistics is the science of analyzing , raw data , field of study , qualitative data analysis coding , qualitative data analysis , qualitative and quantitative data , qualitative and quantitative analysis , qualitative analysis , quantitative analysis , qualitative vs quantitative , nominal data , ordinal data , qualitative data analysis , quantitative data analysis , nominal ordinal interval ratio , how to earn money in data science , qualitative research , statistics for beginners , data analysis in qualitative , qualitative data vs quantitative data , what is qualitative data analysis , qualitative character of statistics is known as , difference between qualitative and quantitative


Wonderful/clear explanation.
Thank you 🙏.
Clear explanation but the background music is very distracted!
Due to amazing visuals topics becomes much more interesting on that your simple and easy explanations on them. Your visuals were cherry on the top for me. Really enjoyed it and able to understand it too, thank you
Hi
Amazing explanation ❤🎉
In qualitative data there is no order in them but there is ordere in their proportions. 56 % may have black hair and 3% may have red hair and so on
excellent
exellent explaination
amazing content
Nice
It was really clear, thanks
You deserve more subs dear
Very good explanation 🤩♥️
Thank you 🖤
In which app you create this video?
Thank you for this amazing visualization !!!
thank you so much...so helpful
Hi
thankyouu
❤❤❤❤❤
❤❤❤❤❤ hi
Anyone who found this on their own reasoning is on a godly level of intelligence.
با آنکه من انگلیسی نمیدانم زیاد ولی تصاویرشما معجزه کرد❤
Brilliant
But if you are counting the number of people with Indian citizenship then you are using the mathematical function "+"
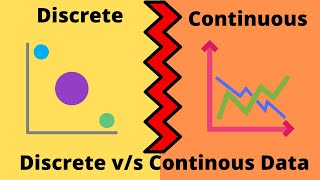
But when you start counting number of people, it itself becomes quantitative data and more precisely discrete data.
I dont understand why you have so less subscribers.
few
This is really good...❤ please make more such videos...❤🙏🙏
Hi
Supeb
Does ordinal scale also measures quantitative data?
Ordinal data is considered “in-between” qualitative and quantitative data. It groups variables into ordered categories, which have a natural order or rank based on some hierarchal scale, like from high to low.
Kindly remove background music
Mam can we apply mean, median and mode on qualitative data ??
We can only apply mode on the qualitative data.
Ok
If Grades is an ordinal data then why can't we measure it???, I mean as we can measure grades, the ordinal data also can be measured
Generally, any student getting marks between 100%-90% is given grade A, any student getting marks between 90%-80% is given grade B and so on. Here, we can only measure the marks but grade is a category assigned based on marks. Hence, grade is labeled as ordinal data in our example.