What is Power Spectral Density (PSD)?

HTML-код
- Опубликовано: 10 фев 2025
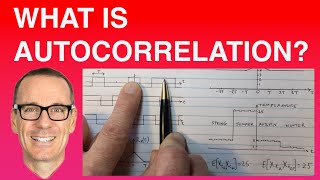
- Explains PSD of random signals from both an intuitive and a mathematical perspective. Explains why it is a "density" and shows the link to Autocorrelation with two common examples in digital communications.
Check out my search for signals in everyday life, by following my social media feeds:
Facebook: www.facebook.c...
Instagram: / iainexplains
Related videos: (see www.iaincolling... )
• What is Autocorrelation? • What is Autocorrelation?
• Autocorrelation and Power Spectral Density (PSD) Examples in Digital Communications • Autocorrelation and Po...
• What does Wide Sense Stationary (WSS) mean? • What does Wide Sense S...
• What is a Random Process? • What is a Random Process?
• What is a Poisson Process? • What is a Poisson Proc...
• What is a Probability Density Function (pdf)? • What is a Probability ...
• What is a Multivariate Probability Density Function (PDF)? • What is a Multivariate...
• Expectation Equation Explained • Expectation of a Rando...
• What is White Gaussian Noise (WGN)? • What is White Gaussian...
• Duality Example in Fourier Transforms • Duality Example of Fou...
• Fourier Transform Duality Rect and Sinc Functions • Fourier Transform Dual...
Full categorised list of videos and PDF summary sheets: iaincollings.com


hating this topic at uni right now but watching your videos is actually making it seem like a fun topic, thank you!
Glad you're finding the videos helpful.
A fundamental topic to DSP and Random Processes. Glad to see you cover it so excellently Professor!
Thanks. I'm glad you liked the video.
@@iain_explainswhat is the E() for? Is it because we average over many sample signals? Can we have same definition without E?
Why did I not find this when I needed it in my studies? lol
Very well explained, way better than my professor back then... Thank you very much!
Thanks. I'm glad you've found it now, and liked it. Perhaps there are other videos on my channel that you might also like to take a trip down memory lane with (I'm often getting comments from people who have graduated some time ago, but like to refresh their memories - and perhaps learn things now that they didn't really understand at the time). iaincollings.com
Loved the explanation of units on this video. Im getting my bachelors in electrical engineering and I have a final on this material tomorrow.
Glad it was helpful! Good luck for tomorrow!
underrated ! , keep going please .
Thanks. Yes, I've got a long "to do" list of videos waiting to be made. If you've got any particular requests/suggestions for topics, let me know.
Thank you for this simple and concise explanation, you were really helpful :)
I'm so glad it helped.
preparing for my gate exams . its helpful ❤
Good luck!!
Fantastic job!
Glad you like it!
I used PSD to analyze the dynamics of ion channels in mammalian cellular membranes.
The corner frequencies which relate to the opening and closing rates of the ion channels can be estimated.
That's sounds very interesting. When I was doing my PhD, my supervisor and another PhD student had a project with a medical researcher looking at ion channel switching. They were using a Hidden Markov Model to characterise the process, and try to estimate the switching times.
@@iain_explains
The ion channels I was studying had a single channel conductance of about 300fS. This was too small to be resolved by single channel patch clamp techniques.
We had to resort to recording currents from the entire membrane (whole cell recordings). And use noise analysis to try and understand the mechanics of the ion channel gating.
If you haven't seen it already, then the research I mentioned is presented in Chapter 19 of this book: "Biological Membrane Ion Channels: Dynamics, Structure, and Applications" edited by Shin-Ho Chung, Olaf S. Anderson, Vikram V. Krishnamurthy.
@@iain_explains
Thanks.
Why would PSD be the choice for identifying these ion channels' frequencies versus using a simple Fourier transform of time domain data to see the frquencies involved in the open-close movement of the channel (not challenging your work, but I'm curious as to when a plain Fourier transform would be appropriate for a physical oscillating system)?
Great Video.
Thank you.
Glad you liked it!
An interesting topic would surely be an analysis of the voice charts. What influence has a change of amplitude, phase and frequency? How do humans perceive these changes?
What makes our voices different from each other? Is it just a change in these 3 parameters? Can we regenerate others voices when we have these 3 parameters? Thanks a lot.
Great suggestion. I'll add it to my "to do" list. In summary, there are more than three parameters that are important, but yes, you can take a voice recording and play it back making it sound like someone else. A basic example of this is the voice-codec found in every mobile phone. It does exactly what you are mentioning, in terms of deriving important parameters from the signal and only sending those - not the "whole sampled signal" - in order to save bandwidth (although it tries to make it sound like the original person).
Thank you so much 🎉
You’re welcome 😊
Thanks for all you videos. I have potential topis for a future video. Perhaps you can elaborate sth. about codebooks with respect to MIMO in 5G. I often read about that. -> the real deployment of MIMO in practical systems
(How many are there? Are they in DL and UL? do you have it at every BS and every UE? What means the terms layer and Precoding Matrix Indicator PMI?)
Thank you very much.
Great suggestion! I'll add it to my "to do" list.
Wait, how is the integral of the input signal squared in joules at ~5:50??? The integral of the 'value' squared times seconds = N*m means the signal x(t) has to be in units of sqrt(m*N/s)
Wish I found your channel earlier!
THANKS
I'm glad you're finding it helpful!
Thank you sir. Can you make videos on channel coding (LDPC codes), different types of channels , machine learning
Thanks for the suggestions. Those topics are on my "to do" list, but it's a long list ...
Why are interested in PSD? Benefit(s)?
Great question. I should have emphasised that more. In many system design problems the signals are random, and you need a mathematical characterisation of the average bandwidth. The PSD gives you this. For example in digital communications for both the digital signal, and also the noise waveform. See this video for more details: "Autocorrelation and Power Spectral Density (PSD) Examples in Digital Communications" ruclips.net/video/XWytSLZZP1A/видео.html
Thanks, I cannot found the summary sheet about that topic on your page.
Sorry, it's on my webpage now (here's the direct link: drive.google.com/file/d/1v9vvaH_9dm45HgbXxmt75M6UNgMCQspy/view ) It's great to hear from people who are using my Summary Sheets! I'm glad you like them.
Great video! I'm a bit confused as to why you can't take the limit of the full signal X(t) (4:24)? Why is the truncation necessary?
Because the FT integral containing X(t) has infinite value when T goes to infinity.
I’m seeing a contradiction here - you’re saying you can’t evaluate the integral when T goes to infinity, but you’re taking the limit of the expected value of the square of the integral as T goes to infinity. If F(f) doesn’t make sense in the limit, how can S(f)?
Yes, it's intriguing ... for example, you can find the integral of 1/(x^2) between alpha and infinity, but you can't find the integral of 1/x between alpha and infinity (because 1/infinity=0, but log(infinity)=infinity).
I guess what I’m confused about is the fact that, by taking T to infinity, it seems you’re effectively no longer truncating X(t). Is that correct?
Hi, great video. I am currently working in structural mechanics and we use Power Spectral Density as an input for random vibration. I would love to know if you could cover an example on how random vibration loads can be converted to PSD inputs. Thanks!
If a signal is a random process, then it has a power spectral density. It doesn't matter if it is an RF signal, acoustic signal, or a physical vibration signal. But I think you might be confusing things a bit. PSD is a characterisation of a random process. It is not an "input".
Rather than input, in structural analysis, would a better way to characterize this is that a Power Spectral Density be used to determine a structure's "response" to a "random process"?
You save my life
I'm glad to hear my video was helpful to you.
so cool video but, there is a specific bibliography for this ?
1:51 Is there a mistake here? You say "you cant take the Fourier transform of a stationary process" Did you mean non-stationary?
No, I did mean what I said. First of all, you can only take the Fourier transform of an actual function - not a random process (which is random). You might be able to take the Fourier transform of a realisation of a random process (because that is an actual function in time), but not if the random process is stationary, because that means the density function is the same for all time - which means realisations will have infinite energy - and you can only take the Fourier transform of a function that has finite energy (except for periodic functions of course, such as sinusoids).
@@iain_explains Im confused here. When you mean Fourier transform, do you include FFT? If so I saw many SW and scopes that takes FFT of random signals. We don't directly need a mathematical function to compute the FFT.
You are confusing a "random process" with a "time-limited signal that was generated with random values". One is a "process" the other is an actual "signal". An actual signal will have a Fourier transform (whether its values were generated in a random way, or in a deterministic way). It will have finite energy, and yes, if it has been sampled in time, then you can use an FFT to evaluate it. A "random process" is a time domain function that can take random values. If it is "stationary", then its PDF is the same "for all time" - which means it is not "time limited", and (in general) any particular realisation will have infinite energy (because it will go for infinite time). Sometimes people are relaxed about their definitions, and simply say that a time-limited signal is "stationary", when what they mean is "it is stationary over the time duration of the signal" ... whatever that means... More details on "random processes" here: "What is a Random Process?" ruclips.net/video/W28-96AhF2s/видео.html
ty
Hi, great introductory video, I was wondering if there is a mathematical way of deducing that the two definitions are equivalent and if so under what condition, do you happen to have any resources for that?
Sorry, I'm not sure what you mean. Which two definitions?
Hi, min 3:02, mean square value shouldn't be divided by the signal period to get the average power ?
Did you watch up to the point where I explained the units along the bottom of the screen?
@@iain_explains Which time ?
Can u plz doa simple example of "9 sine wave summed signal"
1st split final signal into its consituent 9 sine waves using FFT
Then group them by freq into 3 freq bands
Then obtain grms of each band ...sq that & ............Then plot psd points on psd plot
does this video contains the expression to derive psd?
Can we measure this by oscilloscope ? or it just a mathematical concept ?
It depends on what features your oscilloscope has. One some digital oscilloscopes they have a feature that shows the signal in the frequency domain. Depending on how they do this, it might be showing you some sort of average of the Fourier transform, or it might show an average of the square (ie. power) of the FT.
The voice recordings at the beginning, is the amplitude of these signals proporuonal to the sound level (loudness)?
Yes.
You say we cannot take the FT of a stationary process because the signal is all over the time (up to infinity I assume). But, your voice recordings are limited. Isn't that a contradictory?
As I said in the video, my voice recordings are _not_ stationary processes. The pdf is not the same at every time, t ... plus they are finite duration. The maths only holds for stationary processes. I used the voice recordings to highlight the challenges with characterising random signals. I showed an example of a stationary process at 1:51 in the video, where it shows a portion of the process where the pdf is the same at every value of time.
Assume I have a perfect sequence of real Gaussian intensity pulses in time domain. I seem to know that if we measure this sequence with a spectrum analyzer we get a set of delta functions (lines) under a Gaussian envelope. This set of lines is a spectral power, but is it the power spectral density (PSD function in frequency domain)?
Sorry, but your question is a bit vague. It's hard to know exactly what system/signal you're referring to. You'd have to be more specific about what you mean by a "Gaussian intensity pulse". And also what you mean by "a set of delta functions".
@@iain_explains right I need to be more clear. I can put it also a bit more general. I'm talking about a periodic signal. It can be written as a Fourier series, so with a countable number of frequency components. In the frequency domain I expect this to be a sequence of Dirac delta functions. The separation between two consecutive lines being the inverse of the period. While how the amplitude of those lines varies with frequency should encode other properties of the periodic signal. I expect that the envelope should tell something. So my question is: how the PSD of a periodic signal look like? What can I deduct from the envelope of the PSD?
The envelope tells us the magnitude of each frequency component. If they are periodic signals (ie. not random), then there is no notion of "spectrum density". The spectrum will be point masses - just as you explained. ... sorry, I must be missing something in your question.
Does it mean that in digital communications, we usually to use PSD to describe the frequency characteristics of the digital signal? Such as bandwidth usage? Many thanks
Yes, exactly.
I have plotted the audio signal's STFT plot, and in that, I am getting power spectral density (dB/Hz) in negative, what does it signify?
What do you mean "in negative"? Do you mean it has negative amplitudes? (impossible, by definition). Or do you mean it has values for negative frequencies? Or perhaps you are mistakenly thinking that the output of the STFT is a PSD? (which it is not ... a PSD is an "average of squared Fourier transforms", as explained in the video).
@@iain_explains Certainly, Professor. You are correct. After further studying the topic, I discovered that in digital audio, dBFS (decibels Full Scale) is employed. In this system, the highest amplitude within the audio bit depth is used as the reference point, causing all other amplitudes to be represented as negative values. Have I learned it correctly?
@@iain_explains earlier, by negative I meant negative amplitudes
I'm not familiar with dBFS, but what you've described sounds fair enough.
Dear Sir,
I would like to know the difference between spectrum (Fourier transform) and Power Spectral Density (PSD).
It's shown in the definition of the PSD. The FT of a truncated version of the signal is part of the definition of the PSD ... as I explained in the video. I also explained that the PSD can be intuitively thought of as an average of the square of the Fourier transform. Perhaps you might like to watch the video again.
What's the address for sending a graph (square) ruled notebok?
That's not a bad suggestion. I'll look into getting one of those notebooks.
I still don't understand how to calculate it :(
And is that e euler's number?
One way is to calculate the autocorrelation function, and then take the Fourier transform. And yes, e is Euler's number. This video might help: "Why are Complex Numbers written with Exponentials?" ruclips.net/video/Cy5IQnBpJoA/видео.html
What relationship is there among PSD, PFD and FSPL?
I don't understand, sorry. I'm guessing this is intended as a humorous comment on the use of acronyms? Power Spectral Density, Personal Floatation Devices, and Free Space Path Loss?? I don't think they're related.
@@iain_explains Thank you for responding. For PFD, I meant Power Flux Density. I suppose it is also often referred to as simply Flux Density.
@@iain_explains Also, unrelated to the initial content, but since I am already here asking you questions, could you put together a video that covers symbol slicing?
Thanks for the "symbol slicing" suggestion. I've added it to my "to do" list. In terms of your original question: the Power Spectral Density is a representation of the power as a function of frequency, at a specific geographical location (eg. at the transmitter or receiver); the Flux Density is a representation of the power (total, across all frequencies) as a function of geographical location (eg. as a function of the distance from the transmitter); and the Free Space Path Loss is the "power gain" that the signal experiences, as a function of distance from the transmitter - it's a multiplier of the transmitted power (of course this "gain" is less than 1, or if it's expressed in dB, then it is negative).
it looks like frequency domain to me (i mean like after fft)
42115 Vern Station
yeah very interesting but what can I do with it like? What crazy science can I do with it?
Here's a video explaining how it's used in a digital communications scenario: "Autocorrelation and Power Spectral Density (PSD) Examples in Digital Communications" ruclips.net/video/XWytSLZZP1A/видео.html
Great video. If I have a system where I took discreet experimental data points of an oscillatory behavior over a certain time span (no aliasing to worry about) and ended up with my time domain data showing oscillations (no interruptions to this steady state behavior ocurred during the oscillations), if I take a Fast Fourier Transform (FFT) of this data to see the frequency components, is that inappropriate (i.e. should I have taken a PSD instead)? If the above described scenario is inappropriate for a FFT, what would have to have been present (or absent) in my system to make a FFT appropriate to find the constituent frequencies? Thanks.
If your signal is non-random, then you can take the Fourier transform directly (or the FFT, if you've only got a finite time duration sampled version of the signal). You need to consider the PSD when signals are random.
@@iain_explains Yes, I do only have a finite time duration sample of my signal. Regarding the issue of non randomness, would you please tell me what is the name of your video that discusses what characterizes a non random signal? Thanks!
If a function is represented by a mathematical equation that contains a random variable, then the function is random. If it doesn't contain a random variable, then the function is not random.
My brain Herz
🤣
G