Electrochemical Impedance Spectroscopy (EIS): Basics, Experimental and Fitting using ZView & EC Lab

HTML-код
- Опубликовано: 29 авг 2024
- 1. Basics: What is EIS and how to design equivalent circuit !!!
2. Experimental: Electrode set up
3. Fitting: ZView & EC Lab software interface
________________________________________________________________________________________
Instructor: Santanu Mandal


Thank you Sir! The way you represent everything is really commendable!! 🙂
Good explanation of both softwares..!! Hope to see more videos. Thank you.
Well explained tutorial for new users
nicely explained useful video
very clear explanation and awesome content..:)
Thanks for making this useful video
Very useful video bro
Can you please make a video for distribution relaxation times
Very nice video...
Good video👍
please how to calculate the corrosion inhibition value from these data
Very useful content!!👌
Thank you for sharing!
Great explanation, sir I need your assistance it's really important. I am currently on my thesis for biological cell, how can we conclude our cell as a circuit as there are lot of different circuits in the literature. I am very confused please help. Thanks.
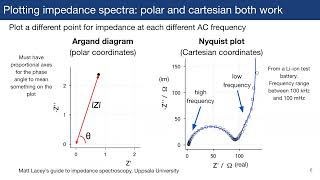
There are standard behaviours for different circuit elements (i.e., resistor, capacitor, inductor, constant phase element (CPE), etc). We need to see the behaviour of our nyquist impedance plot. from there, we have to deduce a circuit. We need to justify our circuit selection based on the actual electrochemical phenomena taking place in our system. There can be multiple circuit combination which will yield the same plot, but we need to justify what circuit elements we take n our circuit. If a nyquist plot is a perfect semicircle, iwe can conclude that the equivalent circuit has a capacitor and resistor in paralel, and we conclude that the nyquist plot is purely capacitive in nature. However, if our nyquist plot is not a perfect semicircle and is slightly flat, we can say that it is not a purely capacitive circuit, and we will take a CPE instead of a capacitor in our equivaent circuit.
You may find the following links useful:
www.gamry.com/application-notes/EIS/basics-of-electrochemical-impedance-spectroscopy/
www.als-japan.com/1902.html
www.sciencedirect.com/science/article/pii/S1572665715301326
www.sciencedirect.com/science/article/pii/S2352492820324405#bib0190
www.mathforengineers.com/AC-circuits-calculators/parallel-RC-circuit-Impedance.html
Exellent !!!!
Clear explanation. Thank you.
You are welcome!
could you explain how to draw it manually the equivalent circuit?
thank you
In Z view software you select the data file. Please do let me know how you make the data file. I have data in logf, Real and Imaginary in -ve value how do prepare the file, rest things I understood. Thank you
The data file is available from the EIS experiment when we run it in the potentiostat.
please tell format of file this zview software supports. as i am not able to add text, excel files
.mpt file
Good work Broo
Thanks mate!!
Hello there. I need to know why you took the other CPE value as 0.9
It was a trial value.
brother, can we find out the corrosion rate by EIS?
No. Impedance plot obtained from EIS is to determine the equivalent impedance of the circuit, and hence we can make a qualitative comparison about which sample offers how much impedance to corrosion, i.e. the polarisation resistance. We can obtain the corrosion rate from Tafel plot.
how to create data file, i have EIS data in excel file.
Copy the data from excel and paste it in a notepad file. Now save the notepad file in "tab delimited" format.
Which software was used?
Z-view
Is there any free software for fitting?
I am not aware of any free software.
I am sorry I couldn't follow your lecture at all. Revise what you doing