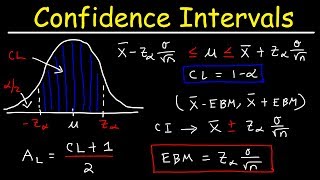
To answer everyone's question about the 1.96. If you go to a Z table and go to 1.96. The percentage is .975. Because the distribution graph is two tailed meaning there is a chunk of area filled in at BOTH ends of the bell curve we multiply the .025 difference by 2 to get 5% 100-5% is equal to 95%. Long Story short. The 1.96 is a z score for 95%
Thank you. Besides the teacher not explaining that this was a great tutorial. However missing that part in the explanation is big and WILL confuse people.
+Nour Alawad Yes, thats what it says in my textbook as well, but HOW exactly do you get 1.96. I just want to know so I can figure it out for other percentages
the 1.96 is the critical value of 95%. kind of like the 68-95-99.7 rule it goes if it was asking for say 90% this time it would be 1.645 90%-1.645 95%-1.960 99%-2.576 the percent is your confidence and the number following is the critical value or z* of your confidence. correct me or explain it better if I am wrong (I'm just learning this in my stats class) but thats to my best understanding!!!
+Donte Buchanan you are right but for those who can't understand or have problem in finding z score can just memorize these 3 intervals 90%,95% and 99% the exam problem will surely be based on these three intervals
why do you use 1.96 if we know our degres of freedom? wouldnt we look that up and see that use like 2.004 since df is 49? this statistic shit is so all over the place
Explanation behind 1.96: The z chart(google it if you dont know what it is) has 1.96= .975. In a bell curve graph, there are two areas that need to be accounted for. These areas are called the critical region. The critical region begins at a certain point on the graph where it would not agree with the 95% confidence level. Since the population or sample mean is ALWAYS labelled on a bell graph as 1, So you subtract 1-.975= 0.025. Since the bell graph displays the mean at the center of the graph(which is 1), its going to stem off into two different directions, and you are going to be left with two numbers that will be equal to or less than a percentage that would make the confidence interval less than 95%. So when you get 0.025, you multiply it by 2 to get 0.05 or 5%. The reason he didn't explain himself is because hes probably at a level in math where that number isnt explained anymore and is taken for granted. I am watching this video to try and understand stats a little better, so bear with me if I left out any information related to the discovery of 1.96.
Thank you thank you! Very well explained. Thanks for teaching it at a novice level. I definitely don't want become a staticitican. Just want to comphrend it.
For those who are asking about the 1.96. To explain it as best I can, you need to draw a normal distribution curve. Now the area under that curve is 100% but here we have the confidence interval of 95%. 100-95 = 0.05 (take it in decimal form). Divide 0.05 by 2 to distribute it evenly on both result being 0.25. 0.5 - 0.025 =0.475. From your Table you will find that 0.475 = 1.96. Sorry if this explanation wasn't mathematical, i have a hard time with this subject as it is xD
there is a simpler way to do this I think. First you need to find the SEaverage. SEaverage = StDv divided by the square root of the number of draws StDv = 1200 Number of draws = 50 sooo...The 95% C.I = 57,000 (+-) 340....which is (56660,57340) :) this is a rough estimate..
+menelick bowizzy 95% CI means we have to get 5% which is 0.05 and i know he just skipped the formula i can not write the same expressions on keyboard but you try to read it and formulate it:x bar + or - z(divide Remaining CI by 2) multiply by standard deviation/root of n. www.google.com.pk/imgres?imgurl=s-media-cache-ak0.pinimg.com/originals/a0/3c/65/a03c650ea3ae2f6ccccfba82ba6ef5bd.jpg&imgrefurl=www.pinterest.com/pin/454089574900344619/&h=120&w=289&tbnid=QEeNmR-JsllhDM:&docid=wFdujU3UfV6fUM&ei=fSSvVsqWL8GIaOehiOAN&tbm=isch&ved=0ahUKEwiKycC0n9bKAhVBBBoKHecQAtwQMwg0KAUwBQ By splitting 0.05 i.e 0.05/2=0.025 now you will have to either memorize it or try to find it by doing(1-0.025=0.975 now look it in the body/bottom of table the closest you get will be on the 1.96 intersection.
Question about 95 confidence interval formula? -20 to 0 °C = Accuracy 2.5 °C 0 to 500 °C =1.8 °C 500 to 1750 °C = Accuracy 1.4 °C According to what I read the uncertainty of the standard would be the resolution is true? If I have 3 readings taken with the standard: 1000, 1500 and 2000 degrees farenheit and the resolution of the standard is 1 °F What would be the steps to do the math calculation and get the uncertainty?
Online Books A Consumer Reports Research Center survey of 427 women showed that 29.0%of them purchase books online.a. Among the 427 women who were surveyed, what is the number of women who said that they purchase books online? b. Find a 95% confidence interval estimate of the percentage of all women who purchase books online. c. Can we safely conclude that less than 50% of all women purchase books online? Why or why not? d. Can we safely conclude that at least 25% of all women purchase books online? Why or why no e. What do the results tell us about the percentage of men who purchase books online?
But your supposed to use a T-Distribution. Due to the fact you don't have stigma. so your t is 2.010. Why did you use z? Since we can only use z when sigma is known.
@gadalaavinash The TI- Simulator is called WabbitEmu. Search WabbitEmu in google and you can find it. I use smart notebook for my recording. There is a built in feature called smart recorder. It is very easy to use. You can download a trial version. Search Smart Notebook download in google. I tried to post the links but it wouldn;t let me. Good luck.
remusomeg naw, I'm pretty sure it's confidence, because it's the confidence interval. I was confused on this at first too, but we talked about it a lot in class 🙄
I did not understand why we used standard deviation sigma instead of sample std dev s, did not we use the data from the sample? If anyone explains, life will be easier for me
Hi I don't understand how to find ic 95 in this kind of exercise. could you help me? In the article, the difference in 28-day mortality between the Lopinavir / Ritonavir group and the Standard Care group was -5.8%. Mortality was rated as similar in both groups. Among the following fictitious results, which one or which will lead us to conclude that the mortality between the two groups is similar? (The 95% confidence interval is given in square brackets) Result A: Mortality difference: -16% [ -30%; -2%] Result B: Mortality difference: -5.8% [-11%; -0.6%] Result C: Mortality difference: -2% [-17%; 13%] Result D: Mortality difference: -0.5% [-3%; 2%].
You sir are seriously a god. I happen to have a very good math teacher, but this shes terrible at explaining!!!! You have saved me so much time and effort
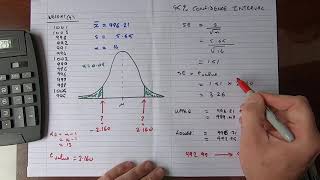
A random sample of 49 lunch customers was taken at a restaurant. The average amount of time the customers in the sample stayed in the restaurant was 45 minutes with a standard deviation of 14 minutes. 1. Construct a 90% confidence interval for the true average amount of time customers spent in the restaurant? 2. Construct a 99% confidence interval for the true average amount of time customers spent in the restaurant? 3. Dscuss why the answers in Parts (1) and (2) are different? 4. With a .95 probability, how large of a sample would have to be taken to provide a margin of error of 2.5 minutes or less? Entire solution
I done this step and the second question for me is.. Find the probability that a titration has a value greater than 8.13ml. It was done 9 times, my final answer was (7.91,8.43), mean = 8.17ml and the standard deviation = 0.04ml. Can anyone help me? Thanks.
+Lasarius2010 sorry my video didn't help. This was made for a grade 11 class I used to teach not university stats. I have a new ci video. Check that out!
with excel, 1.96 is gotten by 95%=0.95; Now taking one halve of the standard table :) ,we have 0.95/2=0.475; and 0.5-0.475=0.025; finally, -1.96=NORM.S.INV(0.025)
In my stats manual = "Perhaps the most common mistake is:" A 95% CI has a 95% probability of holding the true but unknown population parameter of interest" The term "confidence" does not refer to a single confidence interval, but to all confidence intervals that can be constructed from the same population, using the same calculation procedure. If you would calculate a mean and 95% CI for each sample, then 95% of those CIs would contain the true but unknown population mean."
can you help with the following problem:Assume that the annual return (in %) of a certain asset is normally distributed, with a known standard deviation of 5.3%. When a sample of 15 such returns is collected the sample standard deviation is found to be 5.5% and the mean return was found to be 11.2%. Construct a 98% confidence interval for the mean annual return of the asset
Thanks for the video! Im struggling to find some videos like this because I cant follow what my teacher taught me. Happy to find your vid. Thanks! Edit: Oh my God! After watching this vid I try what you taught me and it work!!! Thank you so much! You save me for not having 0 on my test tomorrow! Thankssss!!!!
help me please!!! A sample of 43 students from the agriculture faculty take a Scholastic Aptitude Test the sample has a mean of 520 and a standard deviation of 8. Construct a 95% confidence interval that contains the true population parameter.
Thank you for this explanation. Its very helpfull, but can I ask a question? What extra information did you get from calculating the 95%CI - wasnt it obvious that from looking at the 57000 hours and a standard deviation of 1200 hours that the claim from the company was not supported?


![Confidence Interval [Simply explained]](http://i.ytimg.com/vi/ENnlSlvQHO0/mqdefault.jpg)


You explained in 9 minutes what my professor attempted to explain in 50. Thanks for the video, very helpful.
same! thank you SO MUCH
Hope your prof doesn't see your comment 😂😂
@@hummttydoo6053 been 5 years they don't care anymore XD
To answer everyone's question about the 1.96. If you go to a Z table and go to 1.96. The percentage is .975. Because the distribution graph is two tailed meaning there is a chunk of area filled in at BOTH ends of the bell curve we multiply the .025 difference by 2 to get 5% 100-5% is equal to 95%.
Long Story short. The 1.96 is a z score for 95%
Thank you. Besides the teacher not explaining that this was a great tutorial. However missing that part in the explanation is big and WILL confuse people.
how do you know that 95% is 1.96? is there a rule or something telling us that 95%=1.96 on the CI?
Ryan Butuyan
You have to check the z table!
seriously thank you
Thanks lad!
how to find 1.96 in table??
***** Thanks to you. I passed this subject in my university.
+Nour Alawad Yes, thats what it says in my textbook as well, but HOW exactly do you get 1.96. I just want to know so I can figure it out for other percentages
+Shane Thompson There is a chart, usually. If not you can look one up.
the 1.96 is the critical value of 95%.
kind of like the 68-95-99.7 rule it goes
if it was asking for say 90% this time it would be 1.645
90%-1.645
95%-1.960
99%-2.576
the percent is your confidence and the number following is the critical value or z* of your confidence.
correct me or explain it better if I am wrong (I'm just learning this in my stats class) but thats to my best understanding!!!
+Donte Buchanan you are right but for those who can't understand or have problem in finding z score can just memorize these 3 intervals 90%,95% and 99% the exam problem will surely be based on these three intervals
+Jaffer Zaidi Hi Can you please tell what's up with 90 % and 99 % ?How do we calculate this one?
I think you just saved my life. I have a stats exam tomorrow and this is exactly the kind of explanation i needed! Thank you!!
Hey Everyone! Check out my new 95% Confidence Interval Video:
ruclips.net/video/que_YzwzqGo/видео.html
idk why i was expecting a rick roll but thx
why do you use 1.96 if we know our degres of freedom? wouldnt we look that up and see that use like 2.004 since df is 49? this statistic shit is so all over the place
cant agree more
Explanation behind 1.96:
The z chart(google it if you dont know what it is) has 1.96= .975. In a bell curve graph, there are two areas that need to be accounted for.
These areas are called the critical region. The critical region begins at a certain point on the graph where it would not agree with the 95% confidence level.
Since the population or sample mean is ALWAYS labelled on a bell graph as 1, So you subtract 1-.975= 0.025.
Since the bell graph displays the mean at the center of the graph(which is 1), its going to stem off into two different directions, and you are going to be left with two numbers that will be equal to or less than a percentage that would make the confidence interval less than 95%. So when you get 0.025, you multiply it by 2 to get 0.05 or 5%.
The reason he didn't explain himself is because hes probably at a level in math where that number isnt explained anymore and is taken for granted. I am watching this video to try and understand stats a little better, so bear with me if I left out any information related to the discovery of 1.96.
Thank you for posting this! It's helping me study for my stats test better than my notes or textbook can.
where did you get 1.96?
%95 Confidence Interval is 1.96;
%90 Confidence Interval is 1.645;
%99 Confidence Interval is 2.575;
Google z table. if doing 2 tail use alpha/2, if doing 1 tail use alpha.
do the numbers are fix?
@@saifullahsulaiman3482 yes
Thank you thank you! Very well explained. Thanks for teaching it at a novice level. I definitely don't want become a staticitican. Just want to comphrend it.
+Desmona Strahan Thanks! Keep working hard!
Babae
For those who are asking about the 1.96. To explain it as best I can, you need to draw a normal distribution curve. Now the area under that curve is 100% but here we have the confidence interval of 95%. 100-95 = 0.05 (take it in decimal form). Divide 0.05 by 2 to distribute it evenly on both result being 0.25. 0.5 - 0.025 =0.475. From your Table you will find that 0.475 = 1.96. Sorry if this explanation wasn't mathematical, i have a hard time with this subject as it is xD
90% is 1.645
95% is 1.960 actually
99% is 2.575
where does 1.96 come from?
Confidence level of .95/2 = .4750 the corresponding z value is 1.96
you are so smart.... everyone else is commenting utter bs. *high five*
thank u bro
Thanks . You read my mind
Are you from Newfoundland?
remusomega I am. From Benoit's Cove on the West Coast currently living in St. Anthony.
*****
Awesome! I'm currently in BC myself.
Thanks for the videos btw, this helped during my stats class.
there is a simpler way to do this I think. First you need to find the SEaverage. SEaverage = StDv divided by the square root of the number of draws
StDv = 1200
Number of draws = 50
sooo...The 95% C.I = 57,000 (+-) 340....which is (56660,57340) :) this is a rough estimate..
where the fck does the 1.965 come from?????????????????????????????????????????????????????????????????
+Hunter Levien 95% of the area lies with 1.96 standard deviations of the mean.
thanks barnes i got ya now :D
You lost me at 1.96! :(
I wonder where he got the 1.96 at the 2:25 minute
+menelick bowizzy 95% CI means we have to get 5% which is 0.05 and i know he just skipped the formula i can not write the same expressions on keyboard but you try to read it and formulate it:x bar + or - z(divide Remaining CI by 2) multiply by standard deviation/root of n.
www.google.com.pk/imgres?imgurl=s-media-cache-ak0.pinimg.com/originals/a0/3c/65/a03c650ea3ae2f6ccccfba82ba6ef5bd.jpg&imgrefurl=www.pinterest.com/pin/454089574900344619/&h=120&w=289&tbnid=QEeNmR-JsllhDM:&docid=wFdujU3UfV6fUM&ei=fSSvVsqWL8GIaOehiOAN&tbm=isch&ved=0ahUKEwiKycC0n9bKAhVBBBoKHecQAtwQMwg0KAUwBQ
By splitting 0.05 i.e 0.05/2=0.025 now you will have to either memorize it or try to find it by doing(1-0.025=0.975 now look it in the body/bottom of table the closest you get will be on the 1.96 intersection.
menelick bowizzy z table
Where did the 1.96 come from?
🎉🎉🎉
actually...how to use z table?
i don't understand why sometimes n is replaced by n-1, it has something to do with the degrees of freedom but when do you have to do that?
Question about 95 confidence interval formula?
-20 to 0 °C
= Accuracy 2.5 °C
0 to 500 °C
=1.8 °C
500 to 1750 °C
= Accuracy 1.4 °C
According to what I read the uncertainty of the standard would be the resolution is true? If I have 3 readings taken with the standard: 1000, 1500 and 2000 degrees farenheit and the resolution of the standard is 1 °F What would be the steps to do the math calculation and get the uncertainty?
Online Books A Consumer Reports Research Center survey of 427 women showed that 29.0%of them purchase books online.a. Among the 427 women who were surveyed, what is the number of women who said that they purchase books online?
b. Find a 95% confidence interval estimate of the percentage of all women who purchase books online.
c. Can we safely conclude that less than 50% of all women purchase books online? Why or why not?
d. Can we safely conclude that at least 25% of all women purchase books online? Why or why no
e. What do the results tell us about the percentage of men who purchase books online?
IT IS SIMPLE TO GET FOR 90% IS 1.645 ,95% 1.90 AND 99 IS 1.96 SIMPLE
But your supposed to use a T-Distribution. Due to the fact you don't have stigma. so your t is 2.010. Why did you use z? Since we can only use z when sigma is known.
@gadalaavinash The TI- Simulator is called WabbitEmu. Search WabbitEmu in google and you can find it. I use smart notebook for my recording. There is a built in feature called smart recorder. It is very easy to use. You can download a trial version. Search Smart Notebook download in google. I tried to post the links but it wouldn;t let me. Good luck.
You are not 95% confident the population mean is in your range. It means 95% of your p_hats from your samples will contain your range.
remusomeg naw, I'm pretty sure it's confidence, because it's the confidence interval. I was confused on this at first too, but we talked about it a lot in class 🙄
@@arolynwilliams6454 remusomega is correct. This is a very common misconception with CIs
Your answer is wrong. In the calculator you plugged in 1,200 instead of 12,000
That recording popout is covering some numbers, it gets kind of frustrating, but you explained it okay enough for me to get the gist of it.
I did not understand why we used standard deviation sigma instead of sample std dev s, did not we use the data from the sample? If anyone explains, life will be easier for me
Thumbs up for you buddy
You work hard with mouse 😅
But it worth a lot for us
Thanks man
Keep it up
if the sample size is less than 30, you can use a t-table to approximate the CI
you my friend get a thumbs up, i kept getting lost on the math break down you made it nice and simple!
@iVerbalMurder 95% of the area under the normal curve lies within about 1.96 standard deviations of the mean.
Sir,
Where does the 1.96 came from?
isnt it necessary to know whether the distribution is one tailed or two tailed?
i am still confused on how u got 1.96, is there a way you can show how exactly like a calculation
It’s a constant
U are avoiding to explain where u got 1.96
dude the virtual ti83 is sick. can you teach me how to do that?
For the confidence level is it not N-1?
Thank you for this useful explanation...
It's not that you are 95% confident. You are 100% confident that in 95% of cases the mean will fall within the interval...
Sara Bovo incorrect, it's bad stats practice to ever say that you're 100% confident on anything
yikes
Well, this was super helpful. Looks like I'm not failing my statistics test.
You are welcome!
how did you get 1.96?
Mr. Burns? .... Excellent...
Your mouth is wayyy too close to the speaker! :(
Hi I don't understand how to find ic 95 in this kind of exercise. could you help me?
In the article, the difference in 28-day mortality between the Lopinavir / Ritonavir group and the Standard Care group was -5.8%. Mortality was rated as similar in both groups. Among the following fictitious results, which one or which will lead us to conclude that the mortality between the two groups is similar? (The 95% confidence interval is given in square brackets) Result A:
Mortality difference: -16% [ -30%; -2%]
Result B:
Mortality difference: -5.8% [-11%; -0.6%]
Result C: Mortality difference:
-2% [-17%; 13%]
Result D: Mortality difference: -0.5% [-3%; 2%].
Thanks for showing me the simple step I missed!
You sir are seriously a god. I happen to have a very good math teacher, but this shes terrible at explaining!!!! You have saved me so much time and effort
idk weirdchic Glad I could help!
***** how did you get 1.96?
Shouldn't the mean be both plus and minus the same value? Why do we have 330 and 333, shouldn't they be both the same as we used the same formula?
If you waited 10 seconds he fixes that mistake. it was a typo. He said he was tired lol.
Yeah I am going to fail. Fuck math!
How did he get 1.96??
Ans: (0.5*(1-95/100))=(1/40)*100=2.5
now look at the Table 5 on NCST which is 2.5 is 1.9600
Hope that helps... :)
A random sample of 49 lunch customers was taken at a restaurant. The average amount of time the customers in the sample stayed in the restaurant was 45 minutes with a standard deviation of 14 minutes. 1. Construct a 90% confidence interval for the true average amount of time customers spent in the restaurant? 2. Construct a 99% confidence interval for the true average amount of time customers spent in the restaurant? 3. Dscuss why the answers in Parts (1) and (2) are different? 4. With a .95 probability, how large of a sample would have to be taken to provide a margin of error of 2.5 minutes or less? Entire solution
I done this step and the second question for me is..
Find the probability that a titration has a value greater than 8.13ml.
It was done 9 times, my final answer was (7.91,8.43), mean = 8.17ml and the standard deviation = 0.04ml. Can anyone help me? Thanks.
Pretty useless video when you decide to just throw values at viewers without ever explaining how you got them.
+Lasarius2010 sorry my video didn't help. This was made for a grade 11 class I used to teach not university stats. I have a new ci video. Check that out!
RUclips should open a college
I don’t get the moe 355, how did he get that?
good video. Explained way better than Khan academy
Honestly it's a breath of fresh air. All these videos explaining this in so much complexity and you just did it and I completely understand it now.
+benukysz Thanks!
good
Sample size NEEDS to be greater than 30?
For this formula..yes!
This steps are one of the longest step in finding the confidence interval. Simply use the formula, finding the z value i.e 1.96 . x-E
I feel like Kelso trying to understand this...
+Rex Bruce Same.
with excel, 1.96 is gotten by 95%=0.95;
Now taking one halve of the standard table :) ,we have
0.95/2=0.475; and
0.5-0.475=0.025; finally,
-1.96=NORM.S.INV(0.025)
You've given me Hope that I didn't have! Thank you so much🎊🎊🎉
Please please can you make a quick video to find the z score of 98% significance level. It will be much appreciated.
In my stats manual = "Perhaps the most common mistake is:" A 95% CI has a 95% probability of holding the true but unknown population parameter of interest" The term "confidence" does not refer to a single confidence interval, but to all confidence intervals that can be constructed from the same population, using the same calculation procedure. If you would calculate a mean and 95% CI for each sample, then 95% of those CIs would contain the true but unknown population mean."
That was cool,do another one
can you help with the following problem:Assume that the annual return (in %) of a certain asset is normally distributed, with a known standard deviation of 5.3%. When a sample of 15 such returns is collected the sample standard deviation is found to be 5.5% and the mean return was found to be 11.2%. Construct a 98% confidence interval for the mean annual return of the asset
Thanks for the video! Im struggling to find some videos like this because I cant follow what my teacher taught me. Happy to find your vid. Thanks!
Edit: Oh my God! After watching this vid I try what you taught me and it work!!! Thank you so much! You save me for not having 0 on my test tomorrow! Thankssss!!!!
Mr. Burn?..... excellent
Thanks so much! Really appreciate this video
+davia1013able thanks for watching! Best of luck in your studies!
Why is the MOE 333 and 330?
help me please!!!
A sample of 43 students from the agriculture faculty take a Scholastic Aptitude Test the sample has a mean of 520 and a standard deviation of 8. Construct a 95% confidence interval that contains the true population parameter.
Thanks for the video ... very helpful. But bruh ... the way you was saying X bar had me dyyyyinggggg lmaoooo
but what i see from t-table is from n=40 skipped to n=60 without showing n=40
why do you use z table when you are given SAMPLE standard deviation! Is it supposed to be a t table?
Can anyone help?
mathwithmrbarnes Actually, it is my bad. your sample size is large enough. so you can use z score instead
This was so helpful and easily explained! Thank you!
Is a 99% confidence level a more rigorous estimate of where a parameter is, than a 95%confidence level? Explain
Thank you for this explanation. Its very helpfull, but can I ask a question? What extra information did you get from calculating the 95%CI - wasnt it obvious that from looking at the 57000 hours and a standard deviation of 1200 hours that the claim from the company was not supported?
Thank you so much!
+Josiah Nelson Thanks
This is a great help
Nice video.
thank you
how we can find the number of measurement in any given class interval at95%
helping me in 2018! thanks mr. barnes! ur funny and super informative! im gonna ace my exam!!!
hello, can you please help me, i can't find the 0.475 in my table :( please help i got exams in some days.
okay, fuck. should have gone to my tutes baha
learnt something after 3months of just going to class and having no idea what was happening
Awesome!
yay!
You're my hero
how do u calculate confidence interval for a batch of means
100-95=5/100 is 0.05 so why did u minus 0.5 from 0.025 to get 0.475
After so many other RUclips videos, I finally understood it because of the way you explained it with no difficulties. Thank you!!
I still don't understand how to work out the Ta/2 formula?
thank you so much now I know the correct answer to the question I got wrong in my quiz
thank you thank you thank you mr barnes, I understand now