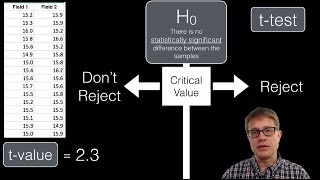
How To... Calculate Student's t Statistic (Paired) by Hand

HTML-код
- Опубликовано: 11 сен 2024
- Learn using step-by-step techniques to calculate the t statistic when comparing dependent/paired samples. This video uses pre-test and post-test scores to check for a significant difference between the two samples.


So it's 2020 and I'm watching this and understanding it for the first time after a semester. Gotta run.. Statistics exam in 20mins.. Thankyou so much👍☺️
Hope you didn't screw up :D
Wat abt now
These videos have been incredibly helpful for my end of module exams at Uni, where we are required to work through examples of several statistical tests by hand.
I finally found it, the right treatment for my thesis😍😍😍😍 thank you so much. This is very comprehensive❤️💛💚💙💜💪😇
Hi Eugene, thank you for these excellent examples of how to do statistical tests by hand. It works really and makes things clearer with the step by step methods.
Agr significant level 10%hoga tu alpha ktna hog???.?
Thank you so so much! This helped me a ton!!! I have an exam this Tuesday!
Finally, a concise and easy to follow formula ❤ i had trouble understanding this topic since every source says different steps and formulas. I will surely follow this formula for my report on this topic.
Taught just as it should be. Very clear and easy to understand the steps and visuals.
Thank you SO MUCH Dr. O'Loughlin! I had trouble understanding this segment and couldn't understand our textbook with its poorly explained examples. Now I understand what, why, and how to calculate the t statistics for comparison purposes.
Great, simple, straight to the point video and a very concise formula. Thanks
here in 2021 cause stat exam due tonight.. thank u Eugene, taught this better than my prof... it really helped clear this up for me !
clear and concise, thank You and blessings from Seattle
Watching this in 2022 and this video explained the t-test in the best way possible!
Thank you so much Eugene. This is a very clear explanation about using t - test. You are very helpful.
best explanation in internet
Beautifully explained, Eugene. Thank you!
Thank you sir! This was the best explaination that I've seen so far
Thanks for the video. It has helped me a lot. Just fyi, your t-stat is actually smaller than t-crit.
you're the best🥳🥳🥳🥳🥳 thank you.. although i would advise you to use more lighting for visibility...but thank you you made me understand this thing and i have exams at 4pm today ... but am confident am good 🥳🥳🥳🥳🥳🥳 thank you Eugene 😇
You always save me at the night before exam 😌
Thanks Eugene. You explain so perfectly. Thanks!
You're truly a genius. Yup simplify this
Wow ...nice explaination sir..I got it fnly which I was searching for👍
Sir there n term is missing at denominator in test statistic formula.
Hello Eugene,
When I've been taught how to calculate these kinds of tests by hand we have always been taught to find the means of the two sets of data, label them A and B and then calculate A - B to get the sum of d. Is there a reason why you don't do this?
Thanks for this though I'm not good in math I still learned from you 😁
Hey Eugene,
In regards to the Tstat being greater than the Tcrit, isn't -4.648 less than -2.160. would that not make it less than cause it's in the minus or am I missing something?
thanks :)
Hi Aoife - remember that with negative values you will be dealing with the left tail. -4.648 lies to the left of -2.160 and therefore falls in to the reject region. Use absolute (no sign) values when making the decision.
Dr E.
@@EugeneOLoughlin That was precisely my question! It's a bit confusing when you show -4 and -2 and you say that -(4 > -2) but now I get it. Thanks.
@@andreamussap
Try plotting the two values on the graph. The curve lies within Tcrtical. If Tstat comes outside the curve, it means Null Hypothesis is rejected, else accepted.
you are a very good teacher. Loves from Turkey
Thank you Prof. This is just what I needed!!
You're my savior
If null hypothesis is pre.test = post.test then why did you find critical value of one tailed test from table instead of 2 tailed test value? You even divided the alpha 0.05÷2=0.025 for two tailed tests and used that to find one tailed test critical value of -2.160. Is that because the T statistics value is negative (-4.648) and you focused on just the negative left side of the bell curve? I don't understand.
Hi Dhana,
The obtained t stat will be in either the left (-ve value) or right tail (+ve value). Because we are doing a two tailed test, we divide 0.05 by 2. Hence the choice of the 0.025 column. Because we have 13 degrees of freedom, the t crit is 2.160 from the table - we change this to a negative value (-2.160) simply because we have calculated a negative t stat.
Hope this helps,
Dr E.
its nice to learn concepts in such simple way...
Thank you for this, mighty helpful!
all of my x1 and x2 values were below 1 so they got smaller as i calculated D squared, which made a negative under the square root for the t value. what do i do to in this situation?
Lovely i enjoyed the lecture more grace
Working on a science fair project and this video really helped explain the paired t-test! Thank you very much :)
Ya really useful
Thank you so much for the video ! THIS IS SO HELPFUL FOR MY EXAM ! You are awesome!
This is very helpful but i'm confused with the alpha you used. You wrote .05 in the given but in illustration you draw it became 0.025? Why is that?
Hi Carla,
The alpha value of 0.05 was chosen by me as an appropriate level for this test. In my hypothesis I also indicated that this is a two-tailed test. Because of this, I have to allocate half my alpha value to the left tail, and half to the right tail. Therefore: 0.05/2 = 0.025, this is the value I use when looking up the critical value.
Hope this helps,
Dr E.
THIS VIDEO WAS SO HELPFUL
Thank you Eugene O'Loughlin
thanks for the elaborate explanations. very useful video!!!
Hi Eugene! Would it be possible to state the alternative hypothesis as H1: Mpost > Mpre? Because in the example, you stated that they are different, but not that Post results were better. Am I right? Thanks for the video, it is really good.
Hi Erich - yes, you could do this. This would be a one-tail test. Many researchers recommend only doing two-tail tests to just look for a difference as it avoids any assumptions.
Dr E.
Perfect lesson!
Thanks for this Eugene! Awesome breakdown of this
Thanks again . I like your explanations
your explanation is amazing thanks a lot for this!
This helped me so much, thank you.
This was very helpful Eugene. Thank you
Good work. Please if u have a question to check if the weights differ btw 11 men and their wives, which T test statistic will u employ? Is it a paired t test or unpaired t test and why?
Star Optometrist That would still be considered a paired sample, but it’s really more accurate to call that a “matched pair” rather than a “dependent pair.” In this case, the same individual isn’t providing both scores for each data pair in the two samples. However, if each subject is as similar as possible to the one it’s matched to except for the variable under investigation, it can more or less be treated the same way as if the two were dependent.
10 out of 10 thanks to this video!!
If 4.648 is positive than right tail test???
Or it's two tail test??
Well explained. But if we use number line, -2 which is the TCrit value is greater than -4 which is the TStat value because -2 is closer to 0 than -4. Why did you do otherwise?
Hi Patrick,
I mostly used absolute values in my classes since the t-tables only show positive values.
Dr E.
Well explained. Thank you🙌🏾🙌🏾
So it depends on the t calculated value that we will considee it as a left handed test or right handed test.... U have mentioned first that the alternative hypothesis is not equal and it is two tail test but at the end it concluded as a one tail test so is it right??
Hi Maira,
No - the calculated t statistic is not dependent on the left/right or vice versa. You (the researcher) decide before you conduct the test as to what the hypothesis is. In this video I am not specifying any direction (ie greater than or less than) - I am simply testing to see if there is a difference (or not) between the two means. If you want to do a one-tail test, you specify up front if you want to do so. For example, I could have tried to show that the post test results are greater than the pre-test results - this would be a one-tail test.
If you get a negative t statistic, you are looking at the left hand side of the curve for critical values. A positive t statistic sends you to the right side.
I recommend you read up on how to specify null and alternate hypotheses.
I hope this helps,
Dr E.
Thank you so very much .You really helped a lot.
Very useful!👍
Good Day, when I used your values in your example using the Excel spreadsheet, the T value obtained = 0.000455917. Can you say why this is or what is different between the formula you used vs the one in Excel?
Hi @Annaramjhingai,
In my example I am using critical values from the t distribution tables to determine whether or not to accept/reject Null Hypothesis by comparing it to my t-stat.
You can also use p values which tools like Excel and SPSS will calculate for you (it is very difficult to attempt by hand). As you have already seen, this is not the same as a t critical value.
Your p value of 0.000455917 is very small. You compare this to your alpha value (0.025 in my example). As your p value is smaller than the alpha value, the decision is to reject Null Hypothesis. Finally, as your value of 0.000455917 is too awkward to report, you should report it as "p < 0.001".
Hope this helps,
Dr E.
This helped so much
Thank youuuu
gracias viejo, sos un ídolo, entendí súoer bien
what is the difference from the formula (*average difference*/(SE of difference) ? Then my statistic is -3.0
i want to ask that i am also calculating two scores,which is pretest n post test scores.so is it also two tailed ?n i need to check the table value at 0.025 level?
Thank you sir, this helped me a lot.
how does this procedure change when it isn't a two tale test?
Thank you!
thank you for the great explanation, but i still don't understand the critical value part
Hi, how do you determine if the test we use is paired or two sample,
You just helped a ton thank you (:
Can someone confirm that this method is useful to find the t-value without having an u (mu)? (T = x - u / s / square root n ) ?
THANK YOU SOOOOOO MUCHHHHHHHHHH SIRRRRRRRR 😩💖
In my class the variance equation on the bottom doesnt multiply the n by the sum of the differences squared
Thank you so much!
Very helpful. Thank you!!!
Thanks you sir, very helpful indeed.
Sir if we are asked to find 95% confidence interval for the mean differences then how to do that. Kindly help sir
Thank u, very useful!
Thank you, this is helpful
Sir, if we're doing one tail test, then no need to divide alpha by 2 right?
Hi Hanz,
That is correct. However, please be careful when reading Statistics Tables to obtain critical values. Some tables show values for both one and two tail tests, while others just show for one tail.
Hope this helps,
Dr E.
Thank you for making this video 😄😄
so you have videos about how to do this but with standard deviation in a similar problem where the sample standard deviation is not known
Hi Dakota,
For a Paired (Dependent) t Test you do not need to know the Standard Deviation of the sample, just follow the steps in the videos to calculate the t statistic.
For an Unpaired (Independent) t Test, you do need to know both of the sample standard deviations.
Hope this helps,
Dr E.
May I ask, why the critical value is negative too?
Hi Nia,
The t tables just have positive numbers - they are used as absolute values. If you get a negative t statistic, you look up the table as if it was a positive value to get the t critical value, and then add a minus sign to the value found.
Hope this helps,
Dr E.
Thanks!
Why is the denominator 13? n is 15 so it should be 14.
How is - 4.668 > - 2.160? Do we have to ignore the negative sign?
Hi - I can see that this might be confusing. It is OK to write this as -4.668 < -2.160 because -4.668 as a value is less than -2.160. Don't ignore the sign, as this tells us that the t stat falls into the left tail. Some people will also interpret the result by ignoring the sign and using absolute values, but it is not good practice to do this.
Dr E.
@@EugeneOLoughlin But in this video you ignored the negative sign. t stat = - 4.648 which is in fact lesser than - 2.160 so you had to have accepted the null hypothesis, but you erroneously rejected it. Please kindly explain that. Thank you for replying.
@@crapbag247 The decision to reject is the correct one. The t stat of -4.668 falls into the reject region of the left tail. The negative sign tells us that we are dealing with the left tail, and it also indicates that the pre-test scores are lower than the post-test scores.
What I feel may be confusing is that I say that -4.668 > -2.160, but this is in absolute value terms. At 9:00 in the video I show on the t distribution diagram where the t stat lies - it is always good to visualise the position of the t stat on the t distribution in this way.
Hope this helps,
Dr E.
@@EugeneOLoughlin Thank you very much, it was very helpful. It was exactly the part that was confusing me.
:-)
It Helped me a lot and answered all queries.Thanks
I got confused by what he said. That the stat is greater than the crit, it should be less than but it'll still reject the null because it's in the rejection region
Hi Hellos - thank you for watching my video.
This can be confusing! The t tables indicate critical values in absolute numbers (no minus signs), so it is common to interpret the result in absolute values. So 4.648 is greater than 2.160 which means a rejection. -4.648 is of course a value less than -2.160, which also places the t stat in the rejection zone.
Hope this helps,
Dr E.
Thankyou so much
why did you take alpha as 0.025 ... in the question given alpha is 0.05... right?
Hi Ann,
As explained at 7:30 in the video, I must divide 0.05 by 2 as this is a two-tailed test.
Dr E.
@@EugeneOLoughlin thank you
explained greatly
So we don't need any variance finding?
Hi D Mustafa,
That's correct. Variance check is not required for paired tests.
Dr E.
hi, didnt you have to find mean?
hello sir i need help
Hello mr.eugene, how -115 came out in the sum of that ?? The - sign??
Hi Lugai,
115 is correct - the signs of the numbers must be taken into account. All the numbers (except one: "5") are negative. If you add up the negative numbers you will get "-120". When you add "5" to this you get "115".
Hope this helps,
Dr E.
isn't the formula with mean and standard deviation of the data? the formula I have studied is X-u/Sd/SQRT n
Hi Atrayee,
There are different ways to conduct this test. The formula you use is an alternative method (which takes longer calculations). Try both, you will get the same answer.
Dr E.
How u find t taste value
Nothing understand
Awesome! Thank you so much. I understand it really well! You are amazing.
You have taught it very nicely i must say but, Your sum of D is incorrect it's not 115 it's 125
Hi Priyanka,
The sum of D is correct at -115.
When you are doing your own calculations note that the third last value (5) is a positive value, all others are negative.
Hope this helps,
Dr E.
Great! Thank you :)
Gosh
Thanks so much
Wonderful
Thank u so much Allah bless you