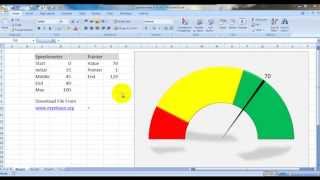
Create a Speedometer Chart with Analog Number in Excel 2016

HTML-код
- Опубликовано: 5 сен 2024
- FREE Download this Chart from below link. Please SUBSCRIBE, Like, Comment and Share this video to your friends and family.
👆 Please Click this link to SUBSCRIBE: www.youtube.co...
💾 Free Download Link:
Download Link 1: docs.google.co...
👩🏫 About Speedometer Chart:
Speedometer Chart or Gauge Charts or Dial Chart save the day when it comes to comparing KPIs or business results against the stated goals. Excel’s massive bag of built-in visualization tools unfortunately has no ready-made solution to offer for such a chart. Hope you will like this chart.
✅ Join us:
RUclips: www.youtube.co...
Blog: afaysal.blogsp...
🎥 Watch our other videos:
1. Emojis in Excel: • How to insert Emojis i...
2. Excel Match function: • Excel Match function a...
3. Excel MID function: • Excel MID Function | E...
4. Add Zero before Numbers in Excel: • How to add Zero before...
5. Hide and Unhide Columns: • How to hide and unhide...
6. Make a Drop-Down list: • How to make a drop dow...
7. My Fiverr Excel Test: • My Fiverr Microsoft Ex...
8. Daily Sales Trend Chart: • Daily Sales Trend Repo...
9. Present vs Previous Sales: • Present vs Previous Mo...
10. Mobile Phone Sales Dashboard: • Mobile Phone Sales Das...
11. Smart Watch Sales Dashboard: • Smart Watch Sales Dash...
12. Gauge Chart: • Dashboard Gadget Gauge...
13. Speedometer Chart: • Dashboard Gadget Speed...
14. Metal Bar Chart: • Infographic Metal Bar ...
15. 2D Pencil Chart: • New Infographic 2D Pen...
16. Test Tube Chart: • Infographic 3D Test Tu...
17. Pillar Chart: • Learn Infographic 3D P...
18. Pencil Bar Chart: • Infographic Pencil Bar...
19. Column Chart with background: • 2D Column Chart with B...
20. Cylinder Chart: • 3D Cylinder Progress C...
#SpeedometerChart #GaugeChart #FaysalEasyExcel


Aapki voice rahegi to aur bhi achaa lagega video
i'll try. thanks.
Ok👍
+1 sub and thumbs up
The customized chart is so impressive!
Thanks a lot
Awsome man. I wonder how to add our own values to the speedometer.
i'v shared the download link, please download this chart and you will find it.
This looks so useful! Could you please share the example file?
sure, you can download it from our blog site.
Can u pls tell me how did you link illustrator text box to cell G3
You can find it in this video at 10:18. First insert an AutoShape, then select the AutoShape, Go to the formula bar, type =G3 or press '=' and click the G3 cell and finally press enter.
Nice video and subs dn
Thanks.
Thank you pin karne ke lyee❤❤❤