Thank you for the video. It was very helpful. Although I had trouble at first because you talk so fast. So, I simply listened to it MANY times and finally got it. Thanks again.
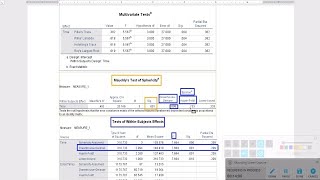
It would probably be worth noting in the video that Multivariate Tests were utilized to assess significance instead of Within-Subject Effects because the assumption of Sphericity (Mauchly's Test) was violated.
ummm, YEAH, because Im using this as a template for a test I'm taking tomorrow, and was under the assumption that the first thing I check (after descriptive's table) is the Multivariate box. This is important information when you're teaching random people on the internet who might not knw any better than to follow what you say. Thank you!!!
I think it's pronounced "Wilks' Lambda (Lam-Duh)" instead of "Wilks' Lam-Beta". Also, I thought you were supposed to observe significant results by looking at the "Tests of Within-Subjects Effects" table as Liz Salas commented about earlier. Have I been interpreting the tables wrong?
drtemple811 Hi. I was just asking because if you do a repeated measures then you are interested in looking at the effects within subjects. I think you meant by 'not looking at the tests of within subjects effects' in your comment? I am pretty sure that you would not necessarily care about the multivariate tests, but the within subjects effects.... But to be sure maybe check with a statistician?? :)
Liz Salas FYI, I think she was using Multivariate Tests in the video because the assumption of Sphericity (Mauchly's Test) was violated with p < 0.05. Thanks again.
I’m stuck on some work . I’m doing change blindness using three conditions in a within repeated measure factorial anova . I’ve analysed my data but don’t know how to work out the results bit ? Please can I email you for help ? Sorry to ask a stranger just I’m confused lol
Hi thanks for your video I have two repeated measures : condition (sham and active stimulation) and task (1-back, 2-back and 3-back). And I have 1 independent variable (stimOrder). Do you know how can I run mediation and moderation analysis for this within subjects ? I check articles of Montoya & Hayes (2017) and Judd & al. (2001) but I don't know can I do ?
Thank you --- Your write up stated the eta squared (.75) however the spss output provided the partial eta squared. Can you explain the difference between the two different effect sizes?
+Shanna Hirsch According to Levene, it is preferable to report eta squared; however, SPSS reports partial eta squared. Cohen discusses this as a measure of effect size. I hand calculate eta squared when publishing for the reasons that Levene discusses. However, in this tutorial, partial eta squared is used. The write up should say partial eta squared. Please see Levene's article at twww.msu.edu/~levinet/eta%20squared%20hcr.pdf
Great tutorial, thank you. I have a question regarding the Mauchly's Test for Shericity. If you have a violation on this, do you report the Greenhouse-Geisser as your significance value in your results or do you still report the Wilks' Lambda as your significance value.
Hi. You would report the Greenhouse-Geisser if sphericity is violated (< .05) and Epsilon (in the Greenhouse-Geisser column) is below .75. This is because the Greenhouse-Geisser provides a more conservative correction, which is needed when Epsilon is further from its optimal value of 1. You would report the Huynh-Feldt in the opposite column if Epsilon is greater then .75, as this provides a more liberal correction, which is needed as >.75 is quite close to 1.
Hello!I was wondering, if there was a different group of people used for each 'Time', would a One-way ANOVA still be used?My example is: I have 3 groups of jellyfish. Each group of jellies was put in a different salinity of water. I measured how each population grew per day in the different salinities, and want to compare any statistical significance. Would I still use this method, having used a different individuals for each independent variable?Thank you xxx
Hi... you may have already got an answer to your question, but I think you'd need a mixed model. You have an option to select within subject and between subject effects on spss. You can use that. I've done something similar in the past using jmp stats package.... there may be some tutorials online for spss
This was really helpful, however, what would you do to understand if there is a difference between males and females scores? how do you interpret the SPSS output?
+Elizabeth K You may consider an independent t-test or one-way between subjects ANOVA if the t-test is not robust enough. There are tutorials on these analyses at thedoctoraljourney.com/ and on this RUclips channel.
+The Doctoral Journey Thank you for responding, however it a within subjects design that i am using. just like the one above but i would like to know if the participants responses differ according to gender. Is there anything you could recommend? I was under the impression that lots of t-tests would increase the chance of error
Great video! In SPSS 25 it seems like the "factors and factor interactions" part under options is missing for the pairwise comparison. Can you advice on how to resolve this? Thanks very much!
Thank you for the video, doctor. It is very helpful to me. And I wonder if we have repeated data and replication data simultaneously, how can we do factorial design(ANOVA) by SPSS. What I mean is: For 10 samples , 5 Male, 5 Female. sample 1, we do treatment 1, treatment 2, treatment 3, sample 2, we do treatment 1, treatment 2, treatment 3, ....... sample 10, we do treatment 1, treatment 2, treatment 3. this will produce 3 repeated data for each sample. So gender can be between subject factor, and treatment be the within subject factor. But if we do 3 replications(maybe random simulation results) for each repeated data. Which means for sample 1(as well as for sample 2~10), 3 replications for treatment 1,3 replications for treatment 2, 3 replications for treatment 3. How can I form the table and do factor factorial design(factorial anova) for this situation? Please help me.
Hello, great video! How can I make a single diagramm in SPSS with 5 personality factors with 2 levels of independent variables? It is an ANOVA repeated measurement.
pretty good, except the end was a little confusing. So this was saying there were in fact differences between groups, and those differences were found between each of the groups. And that anxiety INCREASED with participation in the math anxiety group??? Just want to make sure I understood that correctly.
Good tutorial but could be improved with correct pronunciation. It should be called Wilks' "Lam-duh". After 40 years in statistics, I have never heard Wilks' Lambda called Wilks' "Lamb-beta". Also a sig value of 0.000 is usually evaluated as p


![Seungmin "그렇게, 천천히, 우리(As we are)" | [Stray Kids : SKZ-PLAYER]](http://i.ytimg.com/vi/kAzmhLHePqU/mqdefault.jpg)


I guess the channel is dead.. but still watched it in mid 2024 and it helped it 10 years later!!! Thanks a ton!!
Thank you for the video. It was very helpful. Although I had trouble at first because you talk so fast. So, I simply listened to it MANY times and finally got it. Thanks again.
Thank you for such a great video, it's just like you taught me applying ANOVA by holding my hand ❤ thankyouuu
THANK YOU SO MUCH IT IS VERY HELPFUL. From Ethiopia, Africa
+SISAY ABAYNEH You are welcome.
Two words. Thank you.! Came across your video just as i was about to give up.
It would probably be worth noting in the video that Multivariate Tests were utilized to assess significance instead of Within-Subject Effects because the assumption of Sphericity (Mauchly's Test) was violated.
ummm, YEAH, because Im using this as a template for a test I'm taking tomorrow, and was under the assumption that the first thing I check (after descriptive's table) is the Multivariate box. This is important information when you're teaching random people on the internet who might not knw any better than to follow what you say. Thank you!!!
Thank you for the video. I found it to be so useful. It simplified my understanding.
+Challang Marak You are welcome. I am glad you found this tutorial helpful.
I tried 'rolling my mouse over' but the link wasn't there...
I think it's pronounced "Wilks' Lambda (Lam-Duh)" instead of "Wilks' Lam-Beta". Also, I thought you were supposed to observe significant results by looking at the "Tests of Within-Subjects Effects" table as Liz Salas commented about earlier. Have I been interpreting the tables wrong?
Suppose if you want to compare these 3 times of anxiety in male and females separately. Then what test would you do?
do 'spilt file' on gender and run the repeated measures ANOVA - it will run once for each gender category
why are you looking at the multivariate tests instead of the within subject results table?
Liz Salas That's what I want to know. Have I been interpreting my results incorrectly by looking at the "Tests of Within-Subjects Effects" table?
drtemple811 Hi. I was just asking because if you do a repeated measures then you are interested in looking at the effects within subjects. I think you meant by 'not looking at the tests of within subjects effects' in your comment? I am pretty sure that you would not necessarily care about the multivariate tests, but the within subjects effects.... But to be sure maybe check with a statistician?? :)
Liz Salas That's what I thought. I've been interpreting within-subject effects, but the video confused me a bit. Thanks!
Liz Salas FYI, I think she was using Multivariate Tests in the video because the assumption of Sphericity (Mauchly's Test) was violated with p < 0.05. Thanks again.
I’m stuck on some work . I’m doing change blindness using three conditions in a within repeated measure factorial anova . I’ve analysed my data but don’t know how to work out the results bit ? Please can I email you for help ? Sorry to ask a stranger just I’m confused lol
in pairwise comparison, upper sig value or lower sig value should be considered to check whether the difference is significant or not....
Hello. May I know where is the function of repeated measures in SPSS version 29. Please reply this message if you know. Thank you so much.
Just FYI: Wilk's Lambda is pronounced "lamb" (as in a baby sheep) + "duh".
Grouping,selecting, stability, significent, degree of freedom., questionaires score scale min to max. interpreting outcome.
Great video, but how do you roll over the mouse in order to report. You frequently indicate this in the video. Thanks
Where are the rest of the videos she refers to? I would like to see them linked in the description.
Hi thanks for your video
I have two repeated measures : condition (sham and active stimulation) and task (1-back, 2-back and 3-back). And I have 1 independent variable (stimOrder). Do you know how can I run mediation and moderation analysis for this within subjects ? I check articles of Montoya & Hayes (2017) and Judd & al. (2001) but I don't know can I do ?
Hi! the video is very helpful. thank you.
However does anybody know how is the F value interpreted? What does F=41.711 mean in the Wilks Lambda test?
Thank you --- Your write up stated the eta squared (.75) however the spss output provided the partial eta squared. Can you explain the difference between the two different effect sizes?
+Shanna Hirsch According to Levene, it is preferable to report eta squared; however, SPSS reports partial eta squared. Cohen discusses this as a measure of effect size. I hand calculate eta squared when publishing for the reasons that Levene discusses. However, in this tutorial, partial eta squared is used. The write up should say partial eta squared. Please see Levene's article at twww.msu.edu/~levinet/eta%20squared%20hcr.pdf
is it possible to do this with 2 groups involved instead of 3?
Hi, I like your video! Just one question which we cannnot figure out. How do you add a moderator variable? Thanks alot!
Great tutorial, thank you. I have a question regarding the Mauchly's Test for Shericity. If you have a violation on this, do you report the Greenhouse-Geisser as your significance value in your results or do you still report the Wilks' Lambda as your significance value.
Hi. You would report the Greenhouse-Geisser if sphericity is violated (< .05) and Epsilon (in the Greenhouse-Geisser column) is below .75. This is because the Greenhouse-Geisser provides a more conservative correction, which is needed when Epsilon is further from its optimal value of 1. You would report the Huynh-Feldt in the opposite column if Epsilon is greater then .75, as this provides a more liberal correction, which is needed as >.75 is quite close to 1.
Thanks for this useful video, but where the interpretation of both "Partial Eta Squared" and "Observed Power" can be found?
Thanks in advance
what if your data is in long format, and if subjects do not have the same number of observations (missing data). How does that look?
That was very helpful, Thank you !
Hello!I was wondering, if there was a different group of people used for each 'Time', would a One-way ANOVA still be used?My example is: I have 3 groups of jellyfish. Each group of jellies was put in a different salinity of water. I measured how each population grew per day in the different salinities, and want to compare any statistical significance. Would I still use this method, having used a different individuals for each independent variable?Thank you xxx
+Hayley Glanville There are within and between group ANOVAs. When you are examining different groups, you need to consider a between groups ANOVA.
Hi... you may have already got an answer to your question, but I think you'd need a mixed model. You have an option to select within subject and between subject effects on spss. You can use that. I've done something similar in the past using jmp stats package.... there may be some tutorials online for spss
how do test for homogeneity of variances for repeated measures ANOVA?
thankyou very much...really helped me
This was really helpful, however, what would you do to understand if there is a difference between males and females scores? how do you interpret the SPSS output?
+Elizabeth K You may consider an independent t-test or one-way between subjects ANOVA if the t-test is not robust enough. There are tutorials on these analyses at thedoctoraljourney.com/ and on this RUclips channel.
+The Doctoral Journey Thank you for responding, however it a within subjects design that i am using. just like the one above but i would like to know if the participants responses differ according to gender. Is there anything you could recommend? I was under the impression that lots of t-tests would increase the chance of error
I found this very helpful, thank you!
Barney St Anton You're very welcome. Glad it helped.
+Barney St Anton You are welcome.
Great video!
In SPSS 25 it seems like the "factors and factor interactions" part under options is missing for the pairwise comparison. Can you advice on how to resolve this?
Thanks very much!
FYI: In SPSS 25 the mentioned option is now available separately between post hoc and save.
Thank you for the video, doctor. It is very helpful to me. And I wonder if we have repeated data and replication data simultaneously, how can we do factorial design(ANOVA) by SPSS.
What I mean is:
For 10 samples , 5 Male, 5 Female.
sample 1, we do treatment 1, treatment 2, treatment 3,
sample 2, we do treatment 1, treatment 2, treatment 3,
.......
sample 10, we do treatment 1, treatment 2, treatment 3.
this will produce 3 repeated data for each sample.
So gender can be between subject factor, and treatment be the within subject factor.
But if we do 3 replications(maybe random simulation results) for each repeated data.
Which means for sample 1(as well as for sample 2~10), 3 replications for treatment 1,3 replications for treatment 2, 3 replications for treatment 3.
How can I form the table and do factor factorial design(factorial anova) for this situation? Please help me.
why you didn't report the results for tests of withtin subjects effects?
Thank you so much for sharing this! :D
Hello, great video! How can I make a single diagramm in SPSS with 5 personality factors with 2 levels of independent variables? It is an ANOVA repeated measurement.
+operationcenterbravo I am not sue how to respond as I am not sure what diagram you are referring.
hai,i have 10 groups(4 animals in each) and 0,60,120,180,240 days
measurment of Testosteron hormone . how to do the repeated measures
Lambda. Not lambada.
Also, the "alpha" level isn't less than .05. It's p that's less than .05. Alpha = .05 (that's our criterion IF using NHST).
THANK YOU FOR THIS VIDEO....MAM, I HAVE TWO TIME POINTS (BEFORE AND AFTER TREATMENT)...STILL ANOVA CAN BE APPLIED??
sorry, I know this was posted a year ago but pretty sure if it's just two levels of an independent variable you use an T-test not an ANOVA.
pretty good, except the end was a little confusing. So this was saying there were in fact differences between groups, and those differences were found between each of the groups. And that anxiety INCREASED with participation in the math anxiety group??? Just want to make sure I understood that correctly.
Great video! But quick comment I think you mean Wilk's Lambda and not Wilk's Beta
Multivariet test: 5:19
Reporting of results: 8:21
It would be noteworthy to mention that you violated Sphericity (Mauchly's Test).
Thank you!
+Hunter King you are welcome.
Thank you
very helpful. Thank you!
Thanks a lot
I think you meant 'time' is dependent variable, not independent.
There is a mistake in the results. Instead of 41.17, should be 41.71
aku ora mudeng bu
Cheers
🙏🏿
Good tutorial but could be improved with correct pronunciation. It should be called Wilks' "Lam-duh". After 40 years in statistics, I have never heard Wilks' Lambda called Wilks' "Lamb-beta". Also a sig value of 0.000 is usually evaluated as p
Shut up nerd
You could speak a little slower. What’s the hurry for?
You could slow down the video
@@yarakadulina609 so clever 🙏
Thanks for this useful video, but where the interpretation of both "Partial Eta Squared" and "Observed Power" can be found?
Thanks in advance