Your videos are great, thank you for making them available. I just think you might want to clarify a bit your caveat about correlation versus causation. If two variables are significantly correlated, there must be some sort of relationship between them that involves causality, although the causal relationship may be between a third (unmeasured) variable and the two variables of interest. If there is really no relationship whatsoever between a dog's barking frequency and moon phase, their correlation MUST be close to zero, and certainly not statistically significant. If the two measures are significantly correlated, it necessarily implies that either (1) one directly affects the other or (2) they are both affected by a third variable. In other words, a significant correlation doesn't always means that there is direct causation between the two variables, but even when it doesn't, it still means they are causally connected through a third variable. Keep up the good work!
Mr. Foltz. I am learning a lot from your videos. Thank you for posting them. I'm very new to stats and am hoping you can tell me how I know when a variable has the least amount of variability if two are the same.
In year 4 of 5 of my PhD. Multiple Regression Class is KILLING me! I found your videos as I am trying to increase my conceptual understanding of some of the information that is foundational to what we are doing now. I swear your positive words made me cry! Wish I had found you earlier! Thank you for showing me that there are good stats teachers on the planet, you are a rare breed!
Kimberlee Flatt Hang in there! I have an entire playlist on multiple regression is that if where you are. It may not go into as much excruciating detail as your class but it gives a good foundation on which everything else it based. You can do it! :)
I am on it now. I appriciate all of this effort on your end. I really do want to get this and maybe even be good at it! There's so much research yet to do! (My research interest is in Autism treatment specifically.) I wonder how many people you have helped across a wide range of focused study? You will never know the influence you have had!
I agree. I am using this in my current work. While I learned/used this for my MBA, I've rarely used it in real world applications. The encouragement is appreciated.
Seriously.... you got into PhD and could not understand 100 level statistics ... advantage of being White born in a Western Country. Who gave to admission?
ugh, I wish I discovered this channel like...10 months ago when I had my econometrics class, it would've been a lifesaver. This will help a lot of those who have advance statistics or econometrics. I would recommend though you apply them using SPSS that way you'd help us research student understand more about it. I have a question if you please can answer me, it is related to regression and correlation. so I know that we have to have a high r-square in the regression to show a strong relationship. when I'm running simple linear regression the r-square is negligible (0.17) it is so low also pearson correlation is low at 0.4.I can understand that other factors could contribute to the effect other than this one and that is what I will say when I defend my thesis, but the thing is I came across something that says if your purpose is to predict then you have to have a high r-square. Considering my research question "does workplace bullying predict employees' intention to leave" will this affect negatively my thesis? should I change the 'predict' into 'affect' so no misunderstanding or problems arise when I discuss my results? second: workplace bullying is divided into three groups, does that mean I should use multiple regression instead of linear? I used linear because it is 1 independent variable in the main research question. I did a linear regression for the three groups separately. Thank you in advance!
Oh thanks so much Amy! It is my great pleasure to help where I can. Just pay it forward as the opportunities come, so the saying goes. All the very best! - B
I was struggling with the concepts of covariance and correlation, reading textbooks and papers where they just assume you knew, but now that I saw your last three videos of this list I can finally get them and move on to other material. Thank you!
Hi Ronald! Just spent the evening reorganizing my entire library of statistics videos into playlists. They are sequenced like a typical introductory stats textbook both at the playlist level and inside each playlist. I hope you find it easier to navigate. All the best, B.
B Ali Spread the word! :) But actually, you are getting you through college. By going out and finding the resources you need to learn, you are punching your own ticket to success. Keep on keeping on!
B Ali My goodness thank you so much for your kind words. Many more videos are in the works. Time is the only constraint and I refuse to sacrifice quality, so they take time. stay tuned!
***** Hi sir, I'm not sure if Kalman filter is in line of statistics studies, but if it does, I hope youll make some introduction. On signal smoothing, we normally use SMA and EMA, but Kalman is a step forward. Thank you indeed outstanding teacher.
Nice video, but your dog barking example is not right. The moon does seem to cause the dog to bark. A better example of correlation and not causation would be maple leaves and oak leaves. Both bloom and fall around the same time, but maple trees do not cause oak trees to bloom, the winter does.
This video was not only informative in helping me understand correlation concepts but it was also very encouraging as I'm struggling with a research and stats class having never taken a research or stats class before. Your encouraging comments at the beginning and end do not go unnoticed or unappreciated. Thanks so much!
Hi Jenny! Thank you much for the kind words. Creators like me really appreciate the feedback. Sometimes we just need confidence that we can indeed do it. And you can! You came to find the help you needed and that makes all the difference. Keep on learning! 🐞
Help me.. I'm stuck here..so despise letters in math don't belong only numbers shall be manipulated by cycle of solar Sun moon rise and sets.. Were expanding were flat.. Your only spinning because you drank too much wine.. Was that white yummy..
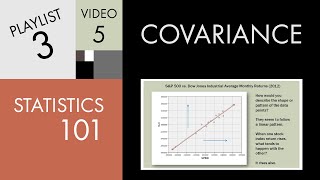
5:32 covariance vs correlation 8:12 correlation caveats 10:53 general correlation patterns 12:15 non-linear relationships 15:35 correlation formula 17:34 example problem
@abhi124s Fantastic! Thank you for your comment. I am thinking about doing some Statistical Quality Control videos in the future so I am glad you are able to apply them to your QA work. Best of luck on your ASQ Black Belt certification! Best, B.
Hi Monique! I am very impressed that you are taking the proactive steps to prepare for the fall semester in April. You should give yourself a large pat on the back for that. Remember there is no need to get overly worked up over the math of stats. IMHO the real important part of stats is understanding the concept behind what you are doing and then the interpretation. You can do it! All the best, B.
Aw I have an exam tomorrow that’s really been giving me such anxiety and I almost cried during your introductory pep talk. Thank you for your content! This is my second video of yours I’m watching and I’m starting to feel more comfortable with correlation and residuals.
Oh thank you your video IDid u see the Harvest moon so beautiful .. I bark . like the viscous poodle.. I find ur video very well organized ..excellent your gunna help me pass . your the best ..
Thank you for your video, Brandon! After watching your multicollinearity video, I went back and coded the correlations and regression equations (which brought me back to this video). However, my IVs are both continuous and categorical. Can I look at correlations if some of the variables are categorical? My understanding is that I can only look at correlations between two continuous variables. For context, I am using SAS software. I apologize if this is a silly question - I am deep down the thesis rabbit hole!
you do it really well!! thank you, your set of videos on variance covariance and correlation have so far cleared my understanding the most, providing everything from definition to inutition to examples and the notion to look at scatter plots first. Thank you very much for making! :)
You’re comment at the beginning like the pep talks just made my whole day , I had such much test anxiety and hearing that is exactly what I needed. You’re the best! Thank you for making a positive impact ! I’m going to ace my test now
Hey Abhijit. That is very nice of you to say. I am sure you are well on your way to becoming a great analyst. Just pay it forward when you see someone else that could use YOUR help. :) All the best, B.
Youy did a better job explaining correlation in 30min than my professor did in 1hour of class. GOD BLESS YOU!!!!!!! Love these videos. Ur a LIFESAVER!!!
You are such a great teacher , have recommended you to my classmates and Professor in Health care MBA studying data analytics and decision making, your videos are definitely one of the best in this particular subject, thanks again
@shadyi Thank you so much for your kind words. Yes I believe in learners (myself included) understanding the concepts behind the formulas. That leads to solid interpretation of the results. Hang in there and keep learning! All the best, B.
Hi Geoffrey! Thank you so much. :) I will...eventually...get to regression. Right now I am working on ANOVA then regression will be next. As the topics become more complex, they take longer to make without sacrificing quality. So subscribe and/or keep checking back. All the best! - B
I was just not understanding the textbook for my statistics class and could not get a good grasp on the concepts I was attempting to learn. After a long history of excellent grades and knowing I was pushing myself to exceed to the best of my ability, I was extremely affected and stressed over the possibility of failing the class. Your videos have really helped me fit the information together in a way that I was just not capable of doing on my own. The laymen explanations, the relatable examples and the positive reinforcement that we as students are doing great really encouraged me to continue pushing through! As of right now, I am maintaining a 96 in the class with only one assignment and one paper left to go (which brought me back to your correlation and regression videos)! Thank you for taking your time to help others succeed and I would definitely keep your intros!
Thank you so much for making these videos. They are really helpful! My lecturer doesn't actually say anything in our statics module lectures, we just have to read off of a poorly worded word document. Your videos are actually making statistics understandable! Thank you so much!
Hi I watched your videos of Bivariate Relationship. They are just awesome and really easy to understand. Its just my humble request if you could make all three aspects of bivariate relationship i.e covariance, correlation and linear regression in a single video explaining their commonalities and differences. Thank you............
The introductory motivational talk is really what I needed right now. I haven’t even started watching the rest of the video and I already appreciate it so much.
Thank you for creating this video. As a college freshman that is starting college after 28 years of being out of any form of formal education, your videos have made it easier to understand and "get through" my statistics class.
Hello Brandon, thank you so much for your videos, they are so helpful and really easy to follow ! I appreciate the time you gave us and your efforts and thank you for being supportive and encouraging ! Have a great day
Very easy to understand. I am looking for Multivariate Correlation to analyze the correlation between multiple variables. Do you have any video on it? Thanks,
Hi Sir, With all due respect, let me thank you for having cleared confusions of my mind on the terms: Covariance, correlation. Please do create such videos with more topics and help us. May the god bless you for your good deed. Thank you, Maneesh Mohan.
Thank you for the great video. But how do you calculate the standard deviation? If I calculate it for the number of workers (x), I get 6.15 not 6.48. And numpy extension for Python gives me the same: In [1]: import numpy as np In [2]: dframe = [12,30,15,24,14,18,28,26,19,27] In [3]: np.std(dframe) Out[3]: 6.1489836558572843
I think there's a miscalculation at 19:14, first box under third column. Instead of 197.16, I think it's supposed to be 19.716. 12-21.3= -9.3 and 20-41.2= -2.12 So, -9.3 x -2.12 = 19.716
What a great refresher. Just what I needed. Can you tell me about the thinking about the Rule of Thumb you provided for coming up with a threshold for r? What makes it a good rule of thumb?
THANK YOU SO MUCH FOR THE PEP TALK AT THE BEGINNING. You are so kind. I seriously was thinking of dropping this class... but you know what? I have faith in me!
Hi I watched your videos of Bivariate Relationship. They are just awesome and really easy to understand. Its just my humble request if you could make all three aspects of bivariate relationship i.e covariance, correlation and linear regression in a single video explaining their commonalities and differences. Thank you............
Great job! I have not looked at this material since college decades ago i am going to graduate business school next Jan MBA program at Willaim and Mary. I needed a refresher. You have made it easy and fun. Thanks!!! James N Zeris, CPA
Hello sir, Your lecture are life savers.But i am facing some problems in inference about the Population Correlation Coefficient(p (greek letter 'rho' )). Please explain this topic sir A.S.A.P. Thanx sir You are doing a great job
Hi Brandon Foltz, it happened to me to start watching your videos with Multiple linear regression, then started to enjoy simple linear regression, covariance and finally (at least in this round of learning) correlation! Quite reverse ha? I suggest like how you have numbered each series of videos ( e.g. the playlist of Multiple linear regression), somehow you indicate in what order the learners should watch the videos from different playlists; especially people like me not with high level of knowledge on statistics. Overall, I take my hat off to you for these videos.
Professor Foltz your work is excellent. I refer many students to your videos in my Stats class. Is there a Playlist 3 Descriptive Statistics I since Playlist 3 shows it to be II. thanks you
Could you possible recommend one or two books providing a more detailed\advanced treatment of correlation? Pitfalls, *proper* usage, etc. I am mainly interested in usage, not underlying mathematical proofs. I will trust the mathematicians that correlation does what they say it does. I want to use it to good effect without inadvertently performing a fundamentally flawed analysis. I found: Correlation, by Peter Y Chen. Any other recommendations would be greatly appreciated. Thank you.
Can you help me understand the "relationship rule of thumb" at 22:30? I thought that whenever the correlation was greater than .25, there was a correlative relationship, because .25 was considered the critical value? But this rule of thumb seems to suggest that .25 is not sufficient, Do you have another video explaining this?
Sir Brandon, good day. I just want to ask about your book reference for the general rule of thumb. It's because I want know the relationship between number of lift truck deployed and the number of incidents of lift truck bumps in a certain manufacturing company. Thank you.
I made a yes/no questions survey with 2 different respondents category (eu and turkey). i got the results and i want to choose the Human Development Index as independant , results from my survey as dependant. And then i want to draw the regression analysis to check if the HDI rankings are affecting the respondents' answers. But my problem is how to transfer the yes/no answers to numbers and arrange it with HDI. Can someone help me?
Sir. Your explanation about correlation was very nice. But I have one doubt. Can you say why the correlation coefficient ranges between -1 to +1 with proof?
Sir. Your explanation about correlation was very nice. But I have one doubt. Can you say why the correlation coefficient ranges between -1 to +1 with proof?
Sir. Your explanation about correlation is very nice. But I have one doubt. Can you say why the correlation coefficient ranges between -1 to +1 with proof?
Sir. Your explanation about correlation is very nice. But I have one doubt. Can you say why the correlation coefficient ranges between -1 to +1 with proof?
Sir. Your explanation about correlation is very nice. But I have one doubt. Can you say why the correlation coefficient ranges between -1 to +1 with proof?
Nice videos thanks alot. also, under the slide ‘Correlation Caveats’ point number 4, could you explain why a high r value of lets say 0.9 does not mean it is statistically significant? or do u have the explanation in another video? thanks again!!
Hi! Can u or anyone reading this suggest me a good source for understanding multigroup hierarchical discrimination method? Pls I can't find anything on youtube! Thank u in advance!
Great, i always have problem understanding statistics coz basic concept didn't entre my mind. This video make me understand this in very nice way. Thanks for nice and clear concept vedio. Wishes 💐
How bad must the education system be that a 27m video on youtube explains the topic better than 3 hours lecturing. God the education system is bad and teachers are absolutely the worst. For me youtube is the best invention which ever existed. Before youtube, I was very bad at school since I could not follow the lecturer in classroom, now I am completing my masters degree and guess what, I learned 99% of the curriculum by watching youtube videos. It is so embarassing when a 2 minute video about Induction (Calculus) better explains the topic than a 3 hour lecture in calculus class. The whole education system is filled with bad teachers. You can only find good teachers when working as employee in a good company.


Your videos are great, thank you for making them available. I just think you might want to clarify a bit your caveat about correlation versus causation. If two variables are significantly correlated, there must be some sort of relationship between them that involves causality, although the causal relationship may be between a third (unmeasured) variable and the two variables of interest. If there is really no relationship whatsoever between a dog's barking frequency and moon phase, their correlation MUST be close to zero, and certainly not statistically significant. If the two measures are significantly correlated, it necessarily implies that either (1) one directly affects the other or (2) they are both affected by a third variable. In other words, a significant correlation doesn't always means that there is direct causation between the two variables, but even when it doesn't, it still means they are causally connected through a third variable. Keep up the good work!
Very special thank's to you Prof.Brandon..
Your awesome Brandon. Great teacher.
You sound a bit like Seth Rogan. Anyone ever tell you that?
You're*
The graphical presentations were great!
great!!! You are the best Brandon, i am really excited in your video. Thank you once again.
Again a great video. So many thanks Brandon!
Mr. Foltz. I am learning a lot from your videos. Thank you for posting them. I'm very new to stats and am hoping you can tell me how I know when a variable has the least amount of variability if two are the same.
Your encouraging words had a great impact on me. Thank you so much, Brandon!
You sexy feeling
great video thank you
brilliant explanation ..
I am here because of UDEMY Data analytics class)
Great Video, thank you, is it possible to have the slides used in this lesson.
God bless you
Do you still make videos? Can you please make intro videos about econometrics? Thanks!!!!
Super....thumbs up.
denis tiyo Thanks Denis! So glad you found the video helpful. Keep on learning! Best, B.
In year 4 of 5 of my PhD. Multiple Regression Class is KILLING me! I found your videos as I am trying to increase my conceptual understanding of some of the information that is foundational to what we are doing now. I swear your positive words made me cry! Wish I had found you earlier! Thank you for showing me that there are good stats teachers on the planet, you are a rare breed!
Kimberlee Flatt Hang in there! I have an entire playlist on multiple regression is that if where you are. It may not go into as much excruciating detail as your class but it gives a good foundation on which everything else it based. You can do it! :)
I am on it now. I appriciate all of this effort on your end. I really do want to get this and maybe even be good at it! There's so much research yet to do! (My research interest is in Autism treatment specifically.) I wonder how many people you have helped across a wide range of focused study? You will never know the influence you have had!
2 years later; How is your research going? I have been diagnosed with Aspergers myself and my interest is in statistics :D
I agree. I am using this in my current work. While I learned/used this for my MBA, I've rarely used it in real world applications. The encouragement is appreciated.
Seriously.... you got into PhD and could not understand 100 level statistics ... advantage of being White born in a Western Country. Who gave to admission?
You saved my PhD analysis; May God bless you forever
Brandon, your kind words of encouragement are absolutely awesome and heartfelt. Thank you so much!
I'm glad I found you! I'm doing an online class and was told to "google" the information I didn't understand...which is practically everything.
ugh, I wish I discovered this channel like...10 months ago when I had my econometrics class, it would've been a lifesaver. This will help a lot of those who have advance statistics or econometrics. I would recommend though you apply them using SPSS that way you'd help us research student understand more about it. I have a question if you please can answer me, it is related to regression and correlation. so I know that we have to have a high r-square in the regression to show a strong relationship. when I'm running simple linear regression the r-square is negligible (0.17) it is so low also pearson correlation is low at 0.4.I can understand that other factors could contribute to the effect other than this one and that is what I will say when I defend my thesis, but the thing is I came across something that says if your purpose is to predict then you have to have a high r-square. Considering my research question "does workplace bullying predict employees' intention to leave" will this affect negatively my thesis? should I change the 'predict' into 'affect' so no misunderstanding or problems arise when I discuss my results? second: workplace bullying is divided into three groups, does that mean I should use multiple regression instead of linear? I used linear because it is 1 independent variable in the main research question. I did a linear regression for the three groups separately. Thank you in advance!
Dude, thank you for the lesson! And for the encouraging words at the beginning of the video. Cheers!
Oh thanks so much Amy! It is my great pleasure to help where I can. Just pay it forward as the opportunities come, so the saying goes. All the very best! - B
I was struggling with the concepts of covariance and correlation, reading textbooks and papers where they just assume you knew, but now that I saw your last three videos of this list I can finally get them and move on to other material. Thank you!
Hi Ronald! Just spent the evening reorganizing my entire library of statistics videos into playlists. They are sequenced like a typical introductory stats textbook both at the playlist level and inside each playlist. I hope you find it easier to navigate. All the best, B.
You are such a great teacher!! Thank you for your uplifting words, I now have the motivation to study for my exam :)
Well thank you! People like yourself inspire me. You will do great I know it! Best, B.
You deserve more subscribers, you're getting me through college!
B Ali Spread the word! :) But actually, you are getting you through college. By going out and finding the resources you need to learn, you are punching your own ticket to success. Keep on keeping on!
my god that opening.... damn it I didnt ask for these feels
I always admire terrific teachers! You sir, are among them. Please do continue making videos, both introductory and more challenging.
B Ali My goodness thank you so much for your kind words. Many more videos are in the works. Time is the only constraint and I refuse to sacrifice quality, so they take time. stay tuned!
***** Hi sir, I'm not sure if Kalman filter is in line of statistics studies, but if it does, I hope youll make some introduction. On signal smoothing, we normally use SMA and EMA, but Kalman is a step forward. Thank you indeed outstanding teacher.
@@BrandonFoltz hii can we use subjective probability into our regression analysis if yes how
Nice video, but your dog barking example is not right. The moon does seem to cause the dog to bark. A better example of correlation and not causation would be maple leaves and oak leaves. Both bloom and fall around the same time, but maple trees do not cause oak trees to bloom, the winter does.
This video was not only informative in helping me understand correlation concepts but it was also very encouraging as I'm struggling with a research and stats class having never taken a research or stats class before. Your encouraging comments at the beginning and end do not go unnoticed or unappreciated. Thanks so much!
Hi Jenny! Thank you much for the kind words. Creators like me really appreciate the feedback. Sometimes we just need confidence that we can indeed do it. And you can! You came to find the help you needed and that makes all the difference. Keep on learning! 🐞
Help me.. I'm stuck here..so despise letters in math don't belong only numbers shall be manipulated by cycle of solar
Sun moon rise and sets.. Were expanding were flat.. Your only spinning because you drank too much wine.. Was that white yummy..
5:32 covariance vs correlation
8:12 correlation caveats
10:53 general correlation patterns
12:15 non-linear relationships
15:35 correlation formula
17:34 example problem
@abhi124s Fantastic! Thank you for your comment. I am thinking about doing some Statistical Quality Control videos in the future so I am glad you are able to apply them to your QA work. Best of luck on your ASQ Black Belt certification! Best, B.
Hi Monique! I am very impressed that you are taking the proactive steps to prepare for the fall semester in April. You should give yourself a large pat on the back for that. Remember there is no need to get overly worked up over the math of stats. IMHO the real important part of stats is understanding the concept behind what you are doing and then the interpretation. You can do it! All the best, B.
Great video, well organized!!!
+Gabriel Nieves Ponce Thanks so much!
O my goodness...the first couple comments of your video has me in tears....Thank you for the reminder. I needed it tonight!
Thank you for posting this video, it really helped me.
Aw I have an exam tomorrow that’s really been giving me such anxiety and I almost cried during your introductory pep talk. Thank you for your content! This is my second video of yours I’m watching and I’m starting to feel more comfortable with correlation and residuals.
You Sexy feeling
Your classes are always very helpful! Thank you, Brandon!
Oh thank you your video IDid u see the Harvest moon so beautiful .. I bark . like the viscous poodle.. I find ur video very well organized ..excellent your gunna help me pass . your the best ..
Great job! You have a real talent for giving clear explanations! Thanks.
Professor, It's explained lucidly.
Suggestion: Pls. give a small question at the end for practice.
Thanks
Thank you for your video, Brandon! After watching your multicollinearity video, I went back and coded the correlations and regression equations (which brought me back to this video). However, my IVs are both continuous and categorical. Can I look at correlations if some of the variables are categorical? My understanding is that I can only look at correlations between two continuous variables. For context, I am using SAS software. I apologize if this is a silly question - I am deep down the thesis rabbit hole!
you do it really well!! thank you, your set of videos on variance covariance and correlation have so far cleared my understanding the most, providing everything from definition to inutition to examples and the notion to look at scatter plots first. Thank you very much for making! :)
You’re comment at the beginning like the pep talks just made my whole day , I had such much test anxiety and hearing that is exactly what I needed. You’re the best! Thank you for making a positive impact ! I’m going to ace my test now
Thank you for the tutorial. Great encouraging words also, I was a struggling student today, then the light went on.
Hey Abhijit. That is very nice of you to say. I am sure you are well on your way to becoming a great analyst. Just pay it forward when you see someone else that could use YOUR help. :) All the best, B.
I posted your channel in a group for people who study data analysis in Egypt, and reactions were very positive , thank you so much
Youy did a better job explaining correlation in 30min than my professor did in 1hour of class. GOD BLESS YOU!!!!!!! Love these videos. Ur a LIFESAVER!!!
You are such a great teacher , have recommended you to my classmates and Professor in Health care MBA studying data analytics and decision making, your videos are definitely one of the best in this particular subject, thanks again
@shadyi Thank you so much for your kind words. Yes I believe in learners (myself included) understanding the concepts behind the formulas. That leads to solid interpretation of the results. Hang in there and keep learning! All the best, B.
Great video, slow enough to take notes while also quick enough not to take too much time!
Hi Geoffrey! Thank you so much. :) I will...eventually...get to regression. Right now I am working on ANOVA then regression will be next. As the topics become more complex, they take longer to make without sacrificing quality. So subscribe and/or keep checking back. All the best! - B
I was just not understanding the textbook for my statistics class and could not get a good grasp on the concepts I was attempting to learn. After a long history of excellent grades and knowing I was pushing myself to exceed to the best of my ability, I was extremely affected and stressed over the possibility of failing the class. Your videos have really helped me fit the information together in a way that I was just not capable of doing on my own. The laymen explanations, the relatable examples and the positive reinforcement that we as students are doing great really encouraged me to continue pushing through! As of right now, I am maintaining a 96 in the class with only one assignment and one paper left to go (which brought me back to your correlation and regression videos)!
Thank you for taking your time to help others succeed and I would definitely keep your intros!
I've always hated math & currently struggling in a stats class. Your encouragement in the beginning really gave me a boost
Amazing Videos about Stats....Simply crystal clear about foundations....very helpful...Big Thank You...Brandon
Thank you so much for making these videos. They are really helpful! My lecturer doesn't actually say anything in our statics module lectures, we just have to read off of a poorly worded word document. Your videos are actually making statistics understandable! Thank you so much!
Hi
I watched your videos of Bivariate Relationship. They are just awesome and really easy to understand. Its just my humble request if you could make all three aspects of bivariate relationship i.e covariance, correlation and linear regression in a single video explaining their commonalities and differences.
Thank you............
The pep talk I didn't know I needed.
I do heavy stats in my PhD and I have never had a stats class. You're a life saver.
I actually think I can pass my stats exam now. Thank you so much, I wish you were my lecturer.
The introductory motivational talk is really what I needed right now. I haven’t even started watching the rest of the video and I already appreciate it so much.
Thank you for creating this video. As a college freshman that is starting college after 28 years of being out of any form of formal education, your videos have made it easier to understand and "get through" my statistics class.
Hello Brandon, thank you so much for your videos, they are so helpful and really easy to follow ! I appreciate the time you gave us and your efforts and thank you for being supportive and encouraging ! Have a great day
Very easy to understand. I am looking for Multivariate Correlation to analyze the correlation between multiple variables. Do you have any video on it? Thanks,
thank you so much for making all these videos. I'm really struggling with stats. I'm worried I'll fail :(
Hi Sir,
With all due respect, let me thank you for having cleared confusions of my mind on the terms: Covariance, correlation. Please do create such videos with more topics and help us. May the god bless you for your good deed.
Thank you,
Maneesh Mohan.
Thank you for the great video. But how do you calculate the standard deviation? If I calculate it for the number of workers (x), I get 6.15 not 6.48. And numpy extension for Python gives me the same:
In [1]: import numpy as np
In [2]: dframe = [12,30,15,24,14,18,28,26,19,27]
In [3]: np.std(dframe)
Out[3]: 6.1489836558572843
OMG Thank you! I have been failing this lesson for a while now! It helped me a lot :)
I think there's a miscalculation at 19:14, first box under third column. Instead of 197.16, I think it's supposed to be 19.716.
12-21.3= -9.3 and 20-41.2= -2.12
So, -9.3 x -2.12 = 19.716
What a great refresher. Just what I needed.
Can you tell me about the thinking about the Rule of Thumb you provided for coming up with a threshold for r? What makes it a good rule of thumb?
THANK YOU SO MUCH FOR THE PEP TALK AT THE BEGINNING. You are so kind. I seriously was thinking of dropping this class... but you know what? I have faith in me!
You sexy feeling
Shouldn't the standard deviation for x be 6.148 and for y it should be 15.829?
Hi
I watched your videos of Bivariate Relationship. They are just awesome and really easy to understand. Its just my humble request if you could make all three aspects of bivariate relationship i.e covariance, correlation and linear regression in a single video explaining their commonalities and differences.
Thank you............
Thanks for being an excellent teacher and telling me to believe in myself!
Great job! I have not looked at this material since college decades ago i am going to graduate business school next Jan MBA program at Willaim and Mary. I needed a refresher. You have made it easy and fun. Thanks!!! James N Zeris, CPA
10:00 , Dog behavior and moon cycles are totally related. Just like DV 911 calls and moon cycles, and births and moon cycles.
Hello sir, Your lecture are life savers.But i am facing some problems in inference about the Population Correlation Coefficient(p (greek letter 'rho' )).
Please explain this topic sir A.S.A.P.
Thanx sir You are doing a great job
Great Video... loved it..simple and easy to understand..thumbs up from Pakistan
Would it be right to assume that correlation is not CAUSATION but a TENDENCY in some sort of context? Question is referred to the author. Thank you.
Hi Brandon Foltz, it happened to me to start watching your videos with Multiple linear regression, then started to enjoy simple linear regression, covariance and finally (at least in this round of learning) correlation! Quite reverse ha? I suggest like how you have numbered each series of videos ( e.g. the playlist of Multiple linear regression), somehow you indicate in what order the learners should watch the videos from different playlists; especially people like me not with high level of knowledge on statistics. Overall, I take my hat off to you for these videos.
Professor Foltz your work is excellent. I refer many students to your videos in my Stats class. Is there a Playlist 3 Descriptive Statistics I since Playlist 3 shows it to be II.
thanks you
Could you possible recommend one or two books providing a more detailed\advanced treatment of correlation? Pitfalls, *proper* usage, etc. I am mainly interested in usage, not underlying mathematical proofs. I will trust the mathematicians that correlation does what they say it does. I want to use it to good effect without inadvertently performing a fundamentally flawed analysis. I found: Correlation, by Peter Y Chen. Any other recommendations would be greatly appreciated. Thank you.
Can you help me understand the "relationship rule of thumb" at 22:30? I thought that whenever the correlation was greater than .25, there was a correlative relationship, because .25 was considered the critical value? But this rule of thumb seems to suggest that .25 is not sufficient, Do you have another video explaining this?
Sir Brandon, good day. I just want to ask about your book reference for the general rule of thumb. It's because I want know the relationship between number of lift truck deployed and the number of incidents of lift truck bumps in a certain manufacturing company. Thank you.
I made a yes/no questions survey with 2 different respondents category (eu and turkey). i got the results and i want to choose the Human Development Index as independant , results from my survey as dependant. And then i want to draw the regression analysis to check if the HDI rankings are affecting the respondents' answers. But my problem is how to transfer the yes/no answers to numbers and arrange it with HDI. Can someone help me?
Thanks for explaining these concepts so well. The quality of your work is exceptional.
Sir. Your explanation about correlation was very nice. But I have one doubt. Can you say why the correlation coefficient ranges between -1 to +1 with proof?
Sir. Your explanation about correlation was very nice. But I have one doubt. Can you say why the correlation coefficient ranges between -1 to +1 with proof?
Sir. Your explanation about correlation is very nice. But I have one doubt. Can you say why the correlation coefficient ranges between -1 to +1 with proof?
Sir. Your explanation about correlation is very nice. But I have one doubt. Can you say why the correlation coefficient ranges between -1 to +1 with proof?
Sir. Your explanation about correlation is very nice. But I have one doubt. Can you say why the correlation coefficient ranges between -1 to +1 with proof?
Brandon, thanks for this video.
You mean to say, A sample of 10 observations and not 10 samples ?
Great day
if the |r| > =2/(s)^(-2) is used as a rule of thumb, how to interpret p-value, please?
Nice videos thanks alot. also, under the slide ‘Correlation Caveats’ point number 4, could you explain why a high r value of lets say 0.9 does not mean it is statistically significant? or do u have the explanation in another video? thanks again!!
Please tell me how maths builds character, stupid pointless addition of a MLK quote at the beginning of the video.
Medical Stats is killing me, I will def subscribe to your videos.. Well Organized!
Hi! Can u or anyone reading this suggest me a good source for understanding multigroup hierarchical discrimination method?
Pls I can't find anything on youtube!
Thank u in advance!
Great, i always have problem understanding statistics coz basic concept didn't entre my mind. This video make me understand this in very nice way. Thanks for nice and clear concept vedio. Wishes 💐
How bad must the education system be that a 27m video on youtube explains the topic better than 3 hours lecturing. God the education system is bad and teachers are absolutely the worst. For me youtube is the best invention which ever existed. Before youtube, I was very bad at school since I could not follow the lecturer in classroom, now I am completing my masters degree and guess what, I learned 99% of the curriculum by watching youtube videos.
It is so embarassing when a 2 minute video about Induction (Calculus) better explains the topic than a 3 hour lecture in calculus class. The whole education system is filled with bad teachers. You can only find good teachers when working as employee in a good company.
You're an absolute legend ! Thanks a ton !
Thanks so much :) Just someone who loves to learn and share it with others. Learners are the Legends.