Create a Bubble Chart

HTML-код
- Опубликовано: 21 авг 2024
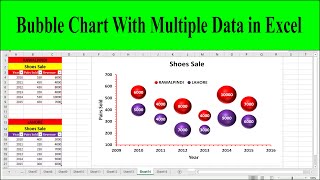
- If you've create x y scatter charts, you'll probably like bubble charts.
In addition to the horizontal and vertical series of data, you can add a third series of data which will show the difference between variable
by varying the size (like the size of a circle or bubble). Check out the video to learn how to create a bubble chart and also using images or picture in the bubble instead of the colors.
🔔 SUBSCRIBE to my channel ➜ goo.gl/wN3c3p
🏫 Excel Training ➜ www.exceltrain...
📚 Excel Books & Tech Gear ➜ www.amazon.com...
⚙️ Tools: Screencasting ➜ techsmith.z6rj...
⚙️ Tools: Microsoft Office ➜ microsoft.msaf...
⚙️ Tools: TubeBuddy ➜ www.tubebuddy....
📝 This description may contain affiliate links and we'll receive a small commission if a purchased is made using the links (but at no additional cost to you). It'll support the channel and so more videos like this can be made. Thanks for your support!
🎁 If you find these videos useful and want to support my channel go to www.buymeacoff...
#excel
#msexcel
#doughexcel
~-~~-~~~-~~-~
Please watch: "Convert Table in a PDF File to Excel"
• Convert Table in a PDF...
~-~~-~~~-~~-~


Far and away the most helpful tutorial on bubble-scatter charts. Thank you so much.
Thanks for the comment!
Hi Doug, this is the best video tutorial I have found. Thank you for sharing your expertise in such an engaging and simple way.
this is hands down the best bubble chart tutorial I've seen, thank you. I'm subscribing to your channel
Thank you for this!! Your video helped me to complete an assignment I was working on. Your video is very detailed and very easy to follow. Thank you again!
THANK YOU Doug! So helpful.
Thanks so much. I was having that problem at the first step when I was highlighting the data headings and it was doing my head in!
I noticed that you do not have to name each data point individually. You right click on the data labels, select Format Data Labels and then click Value From Cells and then just select your list of companies.
+Doug H Yep, using 2013.
GREAT STUFF.LOOKING FORWARD TO UR NEXT LESSON.THANKS
Thanks - very easy to understand!
Extremely helpful. Thanks
Very Helpful, better that the Microsoft website!!
Good one. Easy to understand.
Great Tutorial!!! Have you ever done a bubble chart with 4 colums? For example, the bubble size in your tutorial is the Market Cap, and if you have another bubble size with risks for instance?
Very Helpful….Thanks!
VERY well explained! Thank you
Do you know if there is a way to have the name of the series (e.g.; Apple, Microsoft…) displayed like you show on your chart but having it displayed automatically so that you donut have to edit every single one like you did?
Great tutorial...I'm now a subscriber.
Nice Video. I really like the F2 shortcut. Thank you.
Hi John2000, glad you liked it, thanks for commenting!
Was really helpful...looking for waterfall analysis
Well explained
Congratulations Doug ! You're a super star ! Would you know how to label the colors of bubbles?
Hi Guillaume Villon de Benveniste, thanks for the comment!
THANKS DAWG!
Thanks very good video
Thanks - well done
thanks very helpful
Thank you, Doug. This is exactly what I needed. :D
Thanks Vivin Viswanathan, glad it helped!
great vid, thanks for sharing.
Great video and very confidently presented. You have a great way to show people how to do cool stuff in Excel. Have added the video to the ImproveYourExcel website and I hope this helps increase your subscribers.
Great Video
thanks!
Thank you!!
+Linh Hứa you're welcome!
Hi thanks for your lesson. Can we not done with the the company as the pic indicates the company.my opinion. anyway thanks again.
Can someone confirm that the option to include picture does not exist in Excel 2016?
Hi Andreas Köhler, thanks for the comment!
For decades Microsoft cannot simply make the process of adding labels from a list automatic.
Hi 1dmitryv, thanks for the comment!
LOL
Hi Esther Cho, thanks for the comment!