Это видео недоступно.
Сожалеем об этом.
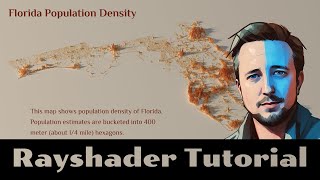
Live Coding: Population Density along the Seine

HTML-код
- Опубликовано: 13 авг 2024
- This is a live coding video that shows my process for creating these sorts of graphics. This is not intended to be a tutorial, and I don't explain things in great detail.


Thanks so much for your tutorials, it's been amazing learning 3d viz in R with them!
Beautiful stuff! Learning to do something like this seems like an excellent project for those starting out with R visualizations. Thank you :)
Thanks!
like the process and video. amazing work!
Thanks!
Esta increíble, ahora aprender R para generar cartográfia tan hermoso como tus trabajos, te admiro.
hello i've been stuck on rasterizing the data and gives me this kind of error: Error in Ops.units(dimensions[[i]]$to, 1) :
both operands of the expression should be "units" objects
Hi,
I am getting error while I am executing the st_read() for gpkg file of France's population.
" The source could be corrupt or not supported. See `st_drivers()` for a list of supported formats. "
Can anyone please tell me how to fix this error? Thank You.
What an amazing package.
Agreed!
> florida_rast
Hi Spencer, It gives the warning --> package ‘MetBrewer’ was built under R version 4.2.3 What should I do.
Thanks for this wonderful tutorial. Is it possible to add rive as a line object within the generated 3d plot? I have tried to do that but the river gets elevated with population z values. I'll be highly obliged if you suggest a code. Thanks again.
Yes, there are a couple ways to do that. You could use rayshader::generate_line_overlay(), though I haven't used this much myself. More info on that here: www.rayshader.com/reference/generate_line_overlay.html.
My preferred method is to simulate data so it's plotted exactly like the rest of the data. I do this by taking the geometry (in this case the river linestring), cast it to a linestring/multilinestring if necessary (not needed for your river), then buffer around it so it will be large enough to show up on the final map, give it a dummie population of 1, then use bind_rows() to add to data. See lines 38-52 of this script: github.com/Pecners/rayshader_portraits/blob/main/R/portraits/oregon/render_graphic.R
i am getting error like admin is not found
Thats Amazing. Thank you very much for posting these videos. I am beginner to R can you please let me know how can I plot for states of other countries. For example in my case I wanted to do the same thing for an Indian state. Your help would be much appreciated
Got the answer from the other video comments.
Good video. Things were going well until this error on render_highquality() step: "Error in rayrender::obj_model(cache_filename, x = -bbox_center[1], y = -bbox_center[2], :
unused argument (texture = TRUE)". Can't find anything online on this one.
Install most recent dev versions of rayshader and rayrender.
remotes::install_github("github.com/tylermorganwall/rayshader")
remotes::install_github("github.com/tylermorganwall/rayrender")
@@MrPecners Great thanks. Back in business.
Was able to replicate the Siene, although with not fully defined hexagons if you zoom in very closely (looks a bit like melted ice cream on top). I tried to do this for a local river (Brisbane river in Australia), but population density is a lot lower, meaning sparse hexagons. Are there any parameters to adjust, or are you better off just visualising high populated regions?
@@MrPecners webpage not found
can you help please?
@grantchalmers3878 You could try upping the resolution, both of your matrix on the front end and of your rendered image on the back end. With sparse population, or more zoomed in areas, I will set solid=TRUE in plot_3d() as well. All that said, yeah low population areas are just harder.
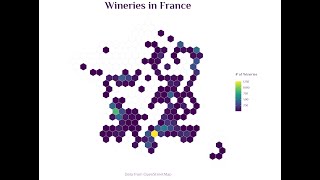
Dude...can you do an example for France ?
I had no idea that you have a youtube channel too😭
It's pretty new!
@@MrPecners i hope you post whenever you feel like it. 🙃