
- Видео 15
- Просмотров 36 939
Spencer Schien
США
Добавлен 10 дек 2022
Welcome to my RUclips channel! This channel mostly focuses on the R programming language, though I may stray a bit from time to time. As with other content I produce, my aim is to cover topics that are not already well-covered by other more knowledgeable creators. My rule of thumb is that if I have to figure something out myself instead of finding a nice blog post or SO thread, then it's a potential topic for me to cover.
I started this channel because I received requests from folks on social media for video tutorials on things I had previously covered with written content such as blog posts and Twitter threads. Prior to that, it hadn't even occurred to me to create videos. I'm always open to topic request or feedback, so please comment or message me if you have anything you want to share!
I started this channel because I received requests from folks on social media for video tutorials on things I had previously covered with written content such as blog posts and Twitter threads. Prior to that, it hadn't even occurred to me to create videos. I'm always open to topic request or feedback, so please comment or message me if you have anything you want to share!
Rayshader Tutorial: Acadia National Park Shaded Relief Map
This is a live coding tutorial where I show how to us the {rayshader} package in R to create a 3D shaded relief map. Acadia National Park serves as an example. Full code available here: github.com/Pecners/rayshader_portraits.
Просмотров: 350
Видео


L'Hexagone en Tour Eiffel
Просмотров 1039 месяцев назад
This fun video show mainland France represented by a hexagonal grid that blinks to simulate the blinking of the Eiffel Tower. France is sometimes called "The Hexagon" (L'Hexagone in French) because it's shape roughly resembles a hexagon. #france #satisfying

Tidyverse tip: Create percentage column with multi-level grouping
Просмотров 12311 месяцев назад
My last video showed how to add a summary column with percentages, and in this video, I expand the example to do the same this with multi-level groups.

Tidyverse tip: easily create percentage column in R
Просмотров 1,3 тыс.11 месяцев назад
It's easy to create a summary column in R that shows percentages.

How to have your computer tell you when your R script finishes
Просмотров 130Год назад
This video shows how you can use the 'say' command on a Mac to make an R script speak when your R script is done.

Live Coding: Vermont Population Density (Part I)
Просмотров 513Год назад
This is a live coding session where I create a 3D population density map of Vermont. This video goes through the rendering process to create the high-quality graphic. Part II will cover adding annotations.
Join and Summarize Spatial Data
Просмотров 1,8 тыс.Год назад
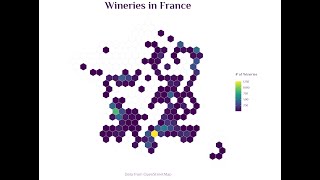
This is an R coding tutorial that shows how combine and summarize spatial data. Specifically, I show how you can take lat-long coordinates, convert them to spatial objects, and join and summarize them with spatial polygons. I show both pre-defined polygons (French Departments) as well as user-created polygons (hexagonal grid). The example I use takes French winery locations from OpenStreetMap d...

Live Coding: Population Density along the Seine
Просмотров 7 тыс.Год назад
This is a live coding video that shows my process for creating these sorts of graphics. This is not intended to be a tutorial, and I don't explain things in great detail.

Double group on x axis with ggplot
Просмотров 3,7 тыс.Год назад
This is a live coding tutorial that shows how you can create a plot that has two levels of groupings along the x axis. This is done by using facets, but hiding all the traditional trademarks of the facet panels. Code can be found here: github.com/Pecners/penguins_facet_live_coding 2:31 Create R Project 4:02 Install Download {palmerpenguins} 6:04 Summarize Data 8:03 Start Plotting 11:28 Add Face...
Rayshader Tutorial-Florida Population Density
Просмотров 21 тыс.Год назад
This is a live-coding tutorial that walks through how to create a 3D population density map in R using the rayshader package. The example uses Kontur Population data for the state of Florida. Code from this tutorial is available here: github.com/Pecners/kontur_rayshader_tutorial NOTE: Before starting, I recommend you install the latest dev versions of rayshader and rayrender to avoid an error t...
I have a similar case where one of my species category (lets assume Gentoo) has only lenght measurements. When I plot I get depth and length labeling to appear under Gentoo but actually there is no depth barplot. How can I tell R Studio to delete the depth barplot for that specific Gentoo species? Thanks in advance
I used following code to add label and label appears in snippet but whenever i use render_highquality, the text label don't appear and is replaced by rectangular box with black color in place of text. i.imgur.com/enW9d47.png render_label(elev_matrix, lat =27.663, long =85.29765, extent=attr(elev_img, "extent"), freetype=T, zscale = 6, text = "My label", textcolor = "Black" dashed = F, textsize = 1, linewidth = 2, linecolor="Darkorange")
Did i miss something in tutorial ? How that 400 meter ( 1/4th mile) was calcualted ?
It’s not calculated in the video, that’s provided by the data source, Kontur.
@@MrPecners Thank you. The tutorial was indeed very helpful.
@@MrPecners How to add scale to show the density value of minimum and maximum density ?
@@MrPecners Is there a way to add color bar with range of matrix using same texture as in plot?
Been doing this and at only at 58:24 you just mentioned you are on Macbook Pro. hahaha
What’s the difference between the matrix size and the high quality render size(width/height)?
What an amazing package.
Agreed!
Do you have a guide to this?
I have tutorials where I walk through the whole process of creating visuals like this. This one is a good starting place: ruclips.net/video/zgFXVhmKNbU/видео.html.
Thank you very much... this was very helpful
Hi Spencer! Thank you very much for your amazing tutorial! I would like to try this. However, I need your help :) In the beginning, you downloaded the states with "tigris" package, but as I understand this is special for the USA. So, how can I download it to Turkey's states? Could you help me, please? Because I am a beginner at this.. Many thanks.. Medine
Hi Medine, thanks for your message! You can use the {geodata} package. For instance, here's some code to get you started: turkey <- geodata::gadm("TUR", level = 1, path = tempdir()) |> st_as_sf()
So amazing! I was wondering if you ever use the threejs package in R to show these datasets on a global 3d map. I have been trying to translate these datasets with that package but I have been having a difficult time. So if you are familiar, I would love to see a tutorial on that!
Amazing work, thank you.
the states function we use from tigris package only loads the states of USA. is there any similar package for India? or how do we go about it while plotting the map of India?
Wow. Cool Stuff. Impressive. Thank you.
Can these be done on Python? I have started to learn Python. Again learning a new language might not be possible for me at this point in life 😢
I would guess there’s a way to do this with python, but I don’t know exactly what libraries to use. Rayshader leverages OpenGL, so maybe some python libraries that utilize that tool would be a place to look?
can we put some gpu acceleration on this? my cpu is dying
thank you so much for this! is there any way to make three levels??
Great tutorial. You can use ggview package to check the right size of graph before saving it. Cheers.
nice one. I tried it but it keeps printing 127 with no auditable feedback
i am getting error like admin is not found
Very easy to follow along.
Lol😂
hello friend I have tried many time to run wineries but it's always end in fail. I don't know how to fix this. 18:00
your voice is so small. please provide the video with good quality of audio either
Yeah. He needs to embiggen that voice.
I can't render in high quality. Tried after updating rayshader & rayrender, still didn't work! > render_highquality( + filename = "images/test_plot.png" + ) Error in rayrender::obj_model(cache_filename, x = -bbox_center[1], y = -bbox_center[2], : unused argument (texture = TRUE)
It's awesome!!!
Great video. I am a beginner in mapping and plotting with R, so I was wondering - is this possible for non-count data? Lets say you wanted to make the same map but with litres of wine produced per cell/geographic area. I'm assuming you'd need an assigned value to each point and somehow sum all point values within each geographic boundary. Is it possible at all or do you have to use another type of method to produce the same maps?
It's possible to do what you describe with basically the same method. You would just swap out the count with a sum of the variable in question. For your example, if each winery had the liters of wine for each winery, you could group by cell and summarize total number of liters in that cell.
@@MrPecners thank you - I’m going to try it out with some data I have as soon as possible!
Hi there, I have just started the tutorial and noticed that the memory usage increases to 6GB or more when reading the data. Is it necessary to have a good CPU and RAM for this tutorial? (my system specs: i5, 4 cores, 16GB RAM.)
You will probably struggle to complete the tutorial doing everything the same as I do because it is pretty memory intensive. You should be able to get through it by keeping everything smaller and lower resolution.
@@MrPecners Thanks for the reply
can you please make the kontur rayshader plot using the same data in this video?
Que buen material. Espero con ansias el video y los datos que utilizas para replicarlo
Thank you so much. I am taking the approach for applications in the oil and gas industry. Could you please show me how to keep the contour of the state map plotted? thanks
Very cool! Here's an example script that you can reference to achieve that, see lines 41-53: github.com/Pecners/rayshader_portraits/blob/main/R/portraits/montana/render_graphic.R
Please upload video of some small country, the Florida data you did on another video my laptop couldn't process that.
What an amazing visualization! This inspired me to make my own visualization. Everything is going well when i working with maps that have width > height, i can get the visualization. But when i'm working with maps that have height > width, i got an error in ph_rast <- st_rasterize(st_ph, nx = floor(size * w_ratio), ny = floor(size * h_ratio)) it's say "Error in UseMethod("units") : no applicable method for 'units' applied to an object of class "c('double', 'numeric')" i really appreciate it if u could help me with this error. Thanks!
Hi Spencer, Thanks a lot for the great video and template code. I ran a few examples and that worked fine. Of course, always time-consuming to find the ideal angles / lighting and resolutions while avoiding crashes. I would have a question related to the height and width. You mention that the unit is in meters based on st_crs(data), but I have some doubts. For Switzerland I get height = 325'262.5m, but Switzerland is only roughly 220km North-South. Could you please clarify?
Hi, I am getting error while I am executing the st_read() for gpkg file of France's population. " The source could be corrupt or not supported. See `st_drivers()` for a list of supported formats. " Can anyone please tell me how to fix this error? Thank You.
Thank you very much! I'm trying to make a map of Israel but I'm having some difficulties. First : Warning in matrix(israel_rast, nrow = floor(size * w_ratio), ncol = floor(size * : data length [30] is not a sub-multiple or multiple of the number of rows [994] and then: > mat |> + height_shade() |> + plot_3d(heightmap = mat) Error: vector memory exhausted (limit reached?) What should i do?
Reading (data <-st_read) layer population not working, Could anyone help me.
Hi Spencer, It gives the warning --> package ‘MetBrewer’ was built under R version 4.2.3 What should I do.
Hi Spencer, great tutorial. Im getting the following error on Win 11: mat |> + height_shade(texture=texture) |> + plot_3d(heightmap = mat, + zscale = 6, + background = "#fff8f2", + solid="FALSE", + shadowdepth=0 + ) Error in solid && !triangulate : invalid 'x' type in 'x && y' In addition: Warning messages: 1: 'rgl.surface' is deprecated. Use 'surface3d' instead. See help("Deprecated") 2: 'rgl.viewpoint' is deprecated. Use 'view3d' instead. See help("Deprecated")
Thank you so much! Amazing content. Your code works perfectly on my windows environment but could not finalise on my Mac. At the last point when I try to visualise and save the output I am getting the following error, I tried literally everything but could not succeed. Any ideas/suggestions? Thanks! Error in render_highquality(filename = outfile, interactive = FALSE, lightdirection = 280, : No rgl window currently open.
update: I solved this issue by XQuartz on macOS, thanks
awesome tutorials sir, What it alternative for tigers package for Indian states.
when executing: mat |> height_shade(texture = texture)|> plot_3d(heightmap = mat, zscale = 80, solid = FALSE, shadowdepth = 0) I get this: Warning messages: 1: 'rgl.surface' is deprecated. Use 'surface3d' instead. See help("Deprecated") 2: 'rgl.viewpoint' is deprecated. Use 'view3d' instead. See help("Deprecated") 3: 'rgl.triangles' is deprecated. Use 'triangles3d' instead. See help("Deprecated") have R 4.2.3 installed... and remotes rayshader... any ideas?
Hello can you help me how to correct this error? Error in rayrender::obj_model(cache_filename, x = -bbox_center[1], y = -bbox_center[2], : unused argument (texture = TRUE)
Same problem here. I updated rayrender and rayshader
Awesome 👏🏻 thanks. Could you do at some point a tutorial how to additionally add mountain reliefs? Living in Switzerland so that would be pretty cool
Encoding both population density and elevation to the height axis can make it very hard to interpret. Here's one example I know of: twitter.com/researchremora/status/1630318714343047171
🙏🏻
Awesome content. How would you label/identify with text on the map the cities of florida? Thanks
There technically is a way to do this with Rayshader, but I prefer to do labeling post-render. I use imagemagick (through the R {magick} package) to add text annotations, and I would do the same to add those labels. That requires manual label placement, though...
Please help me, I'm unable to load the data after downloading into Rstudio.
Hello everyone. If you guys are working on Windows with R 4.2 and the Rstudio crashes/terminates when you run mat |> height_shade(texture = texture) |> plot_3d(heightmap = mat, zscale = 100 ) Then you should use solid = FALSE in the above function and Rstudio would not terminate. So, use the function mat |> height_shade(texture = texture) |> plot_3d(heightmap = mat, zscale = 100, solid = FALSE, ) This problem could be specific to operating system and/or Rstudio/R version. But both I and my colleague faced this issue and it was a working fix. Lastly, great work @Spencer Schien. Wonderful video, keep up the good work.
Hello Spencer, like Tigris package is specifically for US Shapefile. Can you help me with the package solely for Indian shapefile?
Thanks so much for your tutorials, it's been amazing learning 3d viz in R with them!
This is amazing. Can you making a video of converting ggplot to 3d using rayshader. I was trying to convert pie chart but was facing this error (Discrete value supplied to continuous scale). Thanks in advance
You are amazing, great project!!!! And thank you to share your knowledge
Is anyone familiar with the following ERROR: Error in c.units(x = nx[[1L]], y = ny[[1L]]) : units are not convertible, and cannot be mixed; try setting units_options(allow_mixed = TRUE)?
Wrapping w_ratio and h_ratio in as.numeric() should solve this.
I tried using the both solutions mentioned before: units_options(allow_mixed = TRUE) and drop_units(w_ratio) Without any success Im now getting the following ERROR: Error in stopifnot(is.character(values), is.numeric(x)) : argument "values" is missing, with no default