Little's Missing Completely at Random (MCAR) Test - SPSS

HTML-код
- Опубликовано: 15 июл 2024
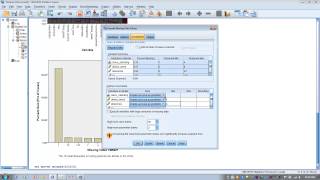
- Learn how to perform and interpret Little's MCAR test in SPSS. Little's test tests the hypothesis that one's data are missing completely at random, which is an assumption that must be satisfied prior to replacing missing values with various imputation techniques.
Missing value analysis


This was incredibly helpful. Thank you.
Thanks for the video.. very useful.
I just did the test on my research data and found the p-value is 0.988 which supports the hypothesis that data is missing completely at random. Will check the next video to see how I can impute the missing value..
Thanks again for explaining the test..
Really excellent explanation. Thanks!
Super Helpful! Thanks!
Very useful. Thank you!
Thanks for this video!
Thank you so much!
Thank you!
Yes, I believe this test would be applicable to rating date derived from any type of survey.
Very helpful, thank you sir.
I would only include a subset of variables that "belong together". That is, variables that are relatively correlated (so, items that are associated with the same subscale, as an example).
Dear how2stats... Thank you for this video...
Thank you.
thank you, it´s helpfull
Thanks, it worked perfectly!
Dude you looked like one of my senior lecturers in the thumbnail - but obviously not. Well played. Thanks for posting.
Thank you very much! That is very helpful!
Does that test work for longitudinal variables as well?
Most awesome thing would be if you had an example of how to report your results in your info-text just below the video there!
Thanks so much though for doing this--you saved me when I was doing my bachelor thesis and are now helping me with my PhD
Thanks!
It's a chi-square statistics, so in this video example, I'd report: chi-square(270, N = 319) = 261.70, p = .630. Reporting N in this case is a bit tricky, because there are varying sample sizes across the variables; I just chose the largest N. You could drop the N if you wanted to I guess.
Thank you so much for the video. In the video you mentioned "imputation" to remedy not missingness at random. You mentioned you will explain it in the next video but which video? I checked your account and there are lots of videos, hard to find the video I am looking for (how to deal with missingness not completely at random). I appreciate your response.
Thanks so much for your great video. I have a data set of around 1630. Some variables are missing in 20% of the sample (the later questions - survey fatigue/drop out). Is there any literature or 'rules' regarding when I delete the participant versus impute data (which isn't missing at random)
Hi, first - thanks for all the videos and answers, it's wonderful!
Question. I have 48 variables for the same phenomena. When I do a factor, my det of correlation matrix is 0,000, many of those correlate with more variables with coefficients above 0,8 so I excluded them.
Is it okay to do an EM on the rest of the variables and work only with those from this point (MCAR is not sign for those)?
Or, do I do EM for the whole sample and then exclude those that correlate (but, for all 48 MCAR is 1,000)
Hello, thanks for your videos, they are very helpful! Can you also offer advice on how to do the same test for categorical variables?
Also if the results are significant, what is the next method? Does it mean imputation is no longer an option and we must use case deletion? Because I think either way would skew the results.
@how2stats Hello! Nice video 🙂 I would like to know how to calculate the reliability of a questionnaire in spss if we have missing data in some questions? Is it using the usual cronbach alpha?? And what should be putten in the cells of the missing data in spss?
Dear how2stats, superthanks for the video! =) I have just 1 question. Are any differences to interpret the results of this test if you add categorical (in my case binary variables)? Thanks a lot in advance!!
Hi, Thanks for helpful videos. I am running Little's MCAR test and I am getting all the tables you mentioned. however, I am also getting this note underneath my EM Estimated Statistics: "b. The EM algorithm failed to converge in 25 iterations." what does it even means?
considering that I have a huge file with 330 variables do I need to ask for 330 iterations?!
I am using version 21 of SPSS (the standard grad pack), and I cannot find "missing value analysis" in the drop-down menu under "analyze." Do you have any suggestions for those of us using a newer version?
Es un muy buen video. Felicitaciones!... Solo que siempre me queda ese mal sabor en la boca con todo esto de la prueba de hipotesis. Ya sabes... la misma logica de aceptar o rechazar un hipotesis basado en valores p se ha cuestionado tanto. Rellenar valores que faltan basandose en esta logica...... bueno, hay que hacerlo no?... pero no me deja un buen sabor en la boca.... hay algo que se nos esta pasando en esta logica de la aceptacion o rechazo de una hipotesis..., a veces me suena hasta a una moda... el problema es que es una moda que con sus resultados puede matar gente (por lo menos en mi area, la salud. Fuera de eso, es un gran video.... Felicitaciones! Congratulations!!!
hello can you help i need to do a cross-validation with SPSS to evaluate a model can you explain to me how to do it thank you
It would be helpful if you explain what analyses the software is doing (e.g. what actual statistical tests is the program doing) in addition to given exposition on the point-and-click method.
My data set has multiple variables, do I run Little's MCAR separately for each variable?
You may do that for each, or all the varibles. Go to missing value analyses, choose variables to analyse, check EM. For each variable, check descriptives and t- test.
Hello what if all my variables are categorical? How then would I use the EM function (little marcs test)? My data is from a survey where participants chose their response (on a likert scale). Thanks
Hmm... I have missing values in my survey, and I'm trying to run a factor analysis (19 variables, and 160 cases). Unfortunately, the MCAR test comes out significant (though I only have 4 out of 19 variable with more than 2% missing). What do I do in this case, since excluding data (listwise or pairwise) and replacing missing values all seem to depend on the data being missing completely at random. But I can't find any pointers to do when it's not missing at random.
Hi. I ran the MCAR on my data set of 27 variables N=59. I'm confused because the output suggested degrees of freedom larger than N (77), which I didn't think is possible, probably gone wrong somewhere. Any ideas?
Hi and thanks for your work. Can you please upload a reference for Little's MCAR test.
Hey How2Stats, thnk you for this vid it really helped me on my research. However I'm having an issue where one of my independent variables is reporting the following: 𝜒2 =.000, df = 0 and p = .000. How should I interpret this or what have I done wrong do you think'? I can't find any explanation of this anywhere? I'm also using SPSS.
Is this only available on certain versions of SPSS? I can't seem to locate this test on the version I'm using, which I think is an updated version at my university.
Hello, I'm getting a significance of "Sig. = 1.000". This doesn't seem right to me but i'm not sure where I'm going wrong... is this correct? Thanks for the videos! :)
so how about my data was missing in a MAR way? Can i still use the EM approach? For my case, i missed one question in my survey for asking the participants to fill it in.Therefore, none of them fill it in. My sample size is 300, can i use Em approach to replace that missing question for all the 300 cases?
Hi, I gos significance level = .
No number is writen, just a dot. Does it show significance?
I'm wondering should I calculate MCAR test across all the variables (dependent, independent, control variables) at the same time or separately, e.g. just for each scale (using the scale items in the analysis) ...
Hi, did you ever get an answer regarding this? I have the same question.
There are a couple questions here first regarding this test for categorical variables, and second for if the test comes out significant, what to do. how2stats - any suggestions?
It means that we are speaking of MAR so you should use the missing values as a subset in your analysis.
Do i have to test for MCAR even if i need to do multiple impuation for missing values?..i have read in a paper that MI does not require or assume the ignorability assumption of missing values..and even if little's stat is significant, can i still do a MCMC for multiple imputation?
thank you for this clear video. I have one question. I just did the Little's MCAR Test on spss and I get a signification 0.000, which means that the missing values are not randomly, so I can not do data imputation. What does that mean and what do you suggest me to do?
There are alternate methods available.
I'm using PASW 18. I'm stuck here. Any help would be appreciated.
The data may be a Multivariate Normal for the little's test? sorry for my poor english
Is it normal that it takes a ridiculous amount of time to run?
And if my sig. it's lower than .05??
hi. my mcar is significant. what do i do? please help
It wasn't on the version I was using, maybe I had a student version. I ran it off SPSS from the university server.
This might sound very stupid, but because all of my variables are categorical (agree-disagree answers, etc), spss does not allow me to click on E.M. Does it mean that little's MCAR only works for quantitative data? Thanks.
not stupid at all, this is my problem as well, I deal mostly with categorical data, so not sure how much little's test would help
i had the same problem but i found out that spss in mac lack certain options.. so you cant see the Missing Value Analysis if your using a Mac computer.. i hope this helps. Good luck
This is an awesome explanation, professor! I have a question: can I check the MCAR assumption of missing values for both baseline and outcome variables simultaneously?
Sorry to be off topic but does any of you know of a method to get back into an Instagram account?
I was dumb forgot the password. I appreciate any assistance you can give me!
@Colby Lucian instablaster ;)
@Mayson Davis I really appreciate your reply. I found the site on google and Im waiting for the hacking stuff atm.
I see it takes a while so I will reply here later when my account password hopefully is recovered.
@Mayson Davis It did the trick and I actually got access to my account again. I am so happy!
Thanks so much, you saved my account!
@Colby Lucian you are welcome :)
Hi, my Little's MCAR test has come up significant p=.000, what can I do about this? My data set is rather large with 458 participants. Any help would be appreciated. Thank you.
I'm not aware of any solution to this problem. You might replace the missing values, anyway, and note it as a limitation that the missing data were not missing completely at random in the Discussion.
I can't find the Missing Value Analysis option under the Analyze tab. Is it located somewhere else in PASW?
Hi Paul,
How did you solve this? I am experiencing the same problem.
Thank you!
My only problem is that when I click on "Analyze," there is no "Missing Values Analysis" tab. I'm in SPSS 28. Does anyone happen to know why it's missing?
If i rejected the null hypothesis, which means my data probably has certain pattern on their missing values, can i keep doing the same proccess you're doing?
Or i have to use another method to estimate my missing values?
+Valentina Pino I'm afraid you don't have much in the way of attractive options when your data are not missing at random. In practice, people just ignore the test, carry on, and pray that no one (reviewers) will ask them about it.
how2stats
Anyway, the p-value is aprox. 4% so i guess is not that bad
how2stats
Oh and thanks for answering!
If the outcome of the Little's MCAR test has a Sig. value of .964
What does this mean?
It means that you do not reject the null hypothesis (since Sig value is greater than the level of significance which is .05 by convention). This would imply that the data are in fact MCAR.
i am Msc student in the field of biometry and i am using spss v20 in order to analyze the survey data that involves several variables
I have just done the MCAR test, between two variables and I got this
EM Meansa
SRSocCL
EdQual3
1.69
1.22
a. Little's MCAR test: Chi-Square = 18.945, DF = 2, Sig. = .000
so what does the 000 mean?
It means p < .001. You have rejected the null hypothesis; your data are not missing at random.
Thankyou, howcome the p-vaule changes from ooo to oo1?.
hi my Little's MCAR test is this: Chi-Square=81.75, DF=66, Sig.=.091.....this means I can do imputation for missing values?
No darling, you can't. Refer to @3:37
Sig=0.05 on EM Means So what should I do in this situation ?
For Little's analysis, if p is not less than .05, the data may be suggested to be missing at random. So, you could argue that you're okay (just barely!).
You would perform the analysis on a set of variables, not an individual variable.
Hello ! Nice video 🙂 I would like to know how to calculate the reliability of a questionnaire in spss if we have missing data in some questions? Is it using the usual cronbach alpha?? And what should be putten in the cells of the missing data in spss?
I am also getting this result for the test: "a. Little's MCAR test: Chi-Square = 17998.374, DF = 21668, Sig. = 1.000" Could you please let me know if it makes sense or not?!!!
Many thanks in advance for your help. I am in the process of analyzing my data for my dissertation and I desperately need somebody to help me with these questions. Thanks!
Hi, I have exactly the same problem :/.what did you finally do?
The sig values indicates it is non-significant, thus it IS Missing Completely at Random (MCAR), which is great. In this situation, you can just delete the cases with missing data probably. Unless those cases with missing data constitute >5% of your sample...
I don't think you much in the way of options, I'm afraid.
It is not significant so yes you can.
thank you ,,, can i have your e mail, i need your help if possible