
- Видео 62
- Просмотров 490 189
Christine Payton
США
Добавлен 16 янв 2023
Microsoft MVP for Power BI; I work with "data stuff" in Microsoft 365! Power BI is my favorite, but I like to make things that combine different aspects of the platform for funsies.
Feel free to connect with me on LinkedIn if you like!
Feel free to connect with me on LinkedIn if you like!
Timeline Zoom & Planner Data in Davide Bacci’s free Gantt template!
Davide Bacci has kindly updated his open source Gantt chart for Power BI to include a timeline zoom to month and year. Here’s how to put our Planner data in it and change out colors and date formats.
David Bacci’s Github: github.com/PBI-David/Deneb-Showcase
Get Planner data in Power BI: ruclips.net/video/q7bkWpVczz0/видео.html
Gem image attribution to pngtree
Here’s the hex codes for the colors if you want to do a find and replace on them for other colors:
Progress bar fill: #c6ecb5
Progress bar border: #a0d786
Grouping fill: #dceaf7
0:00 Intro
0:45 Importing the template
6:04 Customize colors
8:24 Date format
12:33 Dependencies
14:43 Widen task name column
Просмотров: 2 568
Видео


What you need to know about the NEW Planner (and where to find the data!)
Просмотров 10 тыс.2 месяца назад
In the new premium Planner plans, we’re able to connect directly to the tables where our task data lives! We also get some additional features like time tracking and a Gantt chart. This video covers licensing, a feature comparison, and where to get the Planner data without using Power Automate. Feature comparison for project management tools: www.microsoft.com/en-us/microsoft-365/project/compar...

Dark Theme Tutorial for Power BI
Просмотров 2,1 тыс.3 месяца назад
Here’s how to create a dark mode / dark theme for Power BI with translucent side navigation. We’re using Figma to create the background, but that’s not a requirement - just an option! Related videos: INTRO to using Figma with Power BI: ruclips.net/video/nNvz1NAn5XU/видео.html DIY Report background for Power BI with Shapes & Glassmorphism: ruclips.net/video/krzq9vTTATM/видео.html The Figma part ...

How to Add Borders to Your Bars in Power BI
Просмотров 5723 месяца назад
This is about how to add borders, including color-matched borders, to Power BI bar charts. If you're wondering if there's a tutorial for the first goal-to-actual chart with the bars, there is! It's here: ruclips.net/video/2LHfDIlJPXo/видео.html
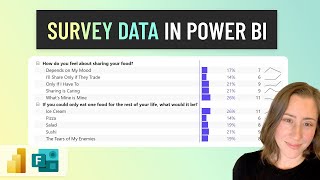
FASTEST Method for Reporting on SURVEY Data in Power BI
Просмотров 7 тыс.3 месяца назад
This technique unpivots Microsoft Forms data in Power Query to combine responses into a single column in Power BI. This lets us calculate percent of total and counts of responses by question without having to create a measure and visual for every question. We connect to the Microsoft Forms data in SharePoint in this example, which we can schedule refresh on, but it will work survey data from ot...

Intro to Copilot Studio - Customize Messaging & Configure Generative Answers
Просмотров 1,3 тыс.4 месяца назад
This is an overview and how to lightly customize a chatbot in Copilot Studio, formerly Power Virtual Agents. We customize the starting conversation, escalation message, route the user to CSAT and accuracy ranking logging, go over authentication & channels, and how the reporting functionality works. 0:00 Intro 0:33 Create the chatbot 4:09 Modify the starting message 4:44 Modify the escalation me...

No-Code AI Prompt with Approval, then ACTION in Power Automate
Просмотров 1,5 тыс.4 месяца назад
This tutorial shows how to make a custom prompt that takes actions with AI Builder in Power Automate. We go over licensing, having a review and approval process for the generated text, and how to reattach the AI-generated data back to the original item. We also get sentiment analysis, because why not? If you'd like to send your emails with a shared mailbox, here's a video on that: ruclips.net/v...
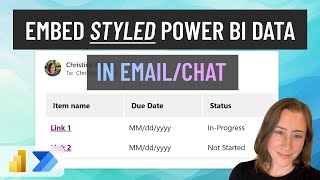
Send STYLED Lists or Tables from Power BI to EMAIL or Chat with Power Automate
Просмотров 4,7 тыс.4 месяца назад
This is a tutorial on how to use the “Run a query against a Power BI dataset” action in Power Automate to send formatted, styled data to users via email or Teams chat message. This can be row data, aggregate data, your measures with or without conditional formatting, whatever you like. You can send the messages to assignees, owners, or any other user attached to your data rows (assuming you hav...

Use the Power Automate visual in Power BI to send notifications for SELECTED items
Просмотров 2,8 тыс.5 месяцев назад
This tutorial is about using the Power Automate visual and integration with Power BI to send Outlook email or Teams notifications based on data in your dataset. This is a button-click trigger using applied filters for more control over what exactly we send notifications for. If you’re tired of asking people to update their tasks/cases/opportunities/tickets each week and want to automate the pro...
Get Planner Data for ALL your Plans in ALL your Groups with Power Automate!
Просмотров 7 тыс.5 месяцев назад
We're taking the process of getting all of our tasks for a Planner plan in Power Automate and extending it to ALL our groups and ALL our plans by adding those actions to an "apply to each" loop. We can schedule the export and the refresh on these so the process is fully automated! This technique is great for when you're managing multiple projects. This video builds on the techniques in prior vi...
How to Redirect Users after Submitting a SharePoint Form!
Просмотров 7525 месяцев назад
We can send form submitters to a thank-you page or specific URL when they're done submitting a form using URL parameters in the link! Note that this does NOT constitute security, so make sure you have your list permissions in place - this is simply a user experience tip. Here's another tutorial on how to set up a SharePoint list to use as an intake form, including things like hiding the "title"...
How to let your VIEWERS "change" visual types!
Просмотров 1,5 тыс.6 месяцев назад
Your viewers can dynamically switch visual types or visual settings by clicking a button! Here's how to set it up in Power BI. You can use this to display the same data different ways, or to display entirely different data. 0:44 Create bookmarks 3:45 Adding buttons
Get Planner Task Details with Power Automate - Assignees, subtasks, buckets, dates!
Просмотров 29 тыс.6 месяцев назад
This video creates a Power Automate flow to extract all of the Microsoft Planner tasks and details and outputs them into a file stored in SharePoint. This includes assignee name and profile, task description, status, buckets, subtasks, and the colored flags/tags. We can connect to the data using Power BI to put it in a table or Gantt chart and then schedule refresh on the dataset! Here's the ne...
Report on Planner Data in Power BI
Просмотров 15 тыс.6 месяцев назад
This video is about how to connect to and model your Microsoft Planner data in Power BI. We’ll go through how to split our Assignees, subtasks, and color flags into dimensions for filtering, then display our subtasks in a table visual with icons to indicate the status. This data source is something we can schedule refresh on, as well as query with Power Automate for more automation fun! The fil...
How to follow Power BI best practices - and get meaningful data doing it!
Просмотров 3 тыс.6 месяцев назад
The idea with building a checklist is both to give you a list of things to remember to do, but also to record that we’ve done it - we can use the checklists we complete as a KPI for ourselves or our team! The checklist items we go over are also available on my blog if you want them in text format: christine-payton.com/power-bi-best-practice-checklist/ Some resources mentioned in the video Meaga...
Automate Saving Files to a Specific Folder with Power Automate Desktop
Просмотров 3,2 тыс.7 месяцев назад
Automate Saving Files to a Specific Folder with Power Automate Desktop
Edit & Annotate PDFs in SharePoint Online
Просмотров 1,2 тыс.7 месяцев назад
Edit & Annotate PDFs in SharePoint Online
Toggle this Power BI slicer setting to "tone down" the giant slider handles!
Просмотров 5 тыс.7 месяцев назад
Toggle this Power BI slicer setting to "tone down" the giant slider handles!
How to Schedule REFRESH on File & Folder Sources in Power BI
Просмотров 10 тыс.7 месяцев назад
How to Schedule REFRESH on File & Folder Sources in Power BI
ALL the tricks to recreate an award-winning Tableau dashboard design in Power BI with CORE VISUALS
Просмотров 4,7 тыс.8 месяцев назад
ALL the tricks to recreate an award-winning Tableau dashboard design in Power BI with CORE VISUALS
Do these 3 Things if you're Applying to Power Platform Jobs
Просмотров 6788 месяцев назад
Do these 3 Things if you're Applying to Power Platform Jobs
Get Data from PDFs and Send to EXCEL with Power Automate Desktop!
Просмотров 41 тыс.8 месяцев назад
Get Data from PDFs and Send to EXCEL with Power Automate Desktop!
Dynamic Row-Level Security in Power BI
Просмотров 4,3 тыс.8 месяцев назад
Dynamic Row-Level Security in Power BI
Get ALL User Profile Data using Power Automate
Просмотров 12 тыс.8 месяцев назад
Get ALL User Profile Data using Power Automate
Get and visualize GROUP MEMBERS & OWNERS with Power Automate & Power BI
Просмотров 5 тыс.8 месяцев назад
Get and visualize GROUP MEMBERS & OWNERS with Power Automate & Power BI
Get ALL SharePoint Sites & Subsites Metrics with Power BI
Просмотров 4,8 тыс.8 месяцев назад
Get ALL SharePoint Sites & Subsites Metrics with Power BI
Get ALL SharePoint Lists and Libraries Analytics
Просмотров 1,3 тыс.8 месяцев назад
Get ALL SharePoint Lists and Libraries Analytics
Get PLANNER Data into Power BI with a 2-ACTION Power Automate Flow!
Просмотров 28 тыс.9 месяцев назад
Get PLANNER Data into Power BI with a 2-ACTION Power Automate Flow!
Does anyone know if there is a way to move this data into an excel sheet without PBI?
How have you created a measure for ticket submitted?
Not sure if this was related to this video or another one - this one is about moving pages? I do have one on using PBI with SP lists, where there's some ticketing reporting... to count tickets there you just do a COUNTROWS() DAX on the table that your tickets are in. The count by user/date/etc is all using the same measure - it's the dimension relationships that group it up on various things.
I'm the 100th person to like the video. Very Informative. Can't be better than this.
cannot express how much this saved me, thank you
Thank you so much. You helped me a lot.
If I ask really nicely, can you post a tutorial about running a scheduled automation to check a planner every night and update a sharepoint list? I have a BEAUTIFUL list that I made when a form is submitted, it creates a planner task and also creates an item in a sharepoint list. I have the task ID in the sharepoint list, but I can NOT for the life of me figure out how to get the list updated. I want to be able to update the sharepoint list using the bucket name, assignee and flags of the task. I was hoping this tutorial would get me there, but I have no idea what Im doing. ALTHOUGH I have no issues following you :) Im begging you from the most sincere deepest part of my heart. It would be SO much easier if there was a trigger from MS that was when a planner task is modified... but we know there isnt so..... I (like many others) need a work around.
What's the reason for sending it to the SharePoint list? Wondering if you can replicate whatever that functionality is without syncing the data back and forth. The issue with trying to keep the tasks up to date in both places is that you have to handle new tasks, updating tasks, and deleting tasks that get deleted in the source. It's better to have the single source of truth be in one place so you don't get people trying to edit from the SP end expecting it to go the other direction as well. If you strongly prefer the SharePoint UI, you could also just bypass Planner entirely and use the list to store the tasks. You can add your own email reminders with Power Automate etc. I would not try to do both or try to sync to both, personally - its more trouble than its worth and there is not a huge benefit. :|
@@bi-ome Well.... we need to keep track on planner for the people who are working the tasks. The sharepoint list is for people that we dont want to have access to the list (they always seem to do weird things when they have access). We need to have the submitter information and data that is only captured via the form. So the SP List is a combination of both the form and planner task status. Im not sure how else to capture the information :'(
@@karenchambers79 oh, are you trying to essentially use it as a ticketing system then? If that's the case, I would do away with the Planner bit. You can use just the list, or if you want to get really fancy you could put a Power App on it. That way, they can submit there directly (there's even a new form feature for this in lists), and you can set it to "users can only see/edit their own items" if you want to prevent them from screwing things up. I did an article on this a ways back if it is useful at all: christine-payton.com/request-managment-in-m365-lists/
@@bi-ome I wish it was that easy, my team is currently running tasks for 12 different planners, using buckets as different steps in the process. We need to be able to provide a report (The List) that has the status and step (bucket), who its assigned etc. The report also needs to have who submitted it, date time etc so they can filter through. The only way Ive been able to do this is, a form is submitted that data gets fed into planner. Once the task is created the information from the form is sent over to SP list with the taskID. I was using the taskID to connect the planner to the list... but it isnt working now. Im losing my mind slowly. Also side note, I have no idea what Im doing. I look up tutorials and sift through forums to try to accomplish what my brain thinks can be done. Other than that... I know nothing lol
@@karenchambers79 Right, you're going to have a hard time the way you're trying to use them together in this instance. Not only is it technically difficult but the tools are going to fight you, because they're not really designed to be used this way - so it's going to be crazy-making. I think what you need is a single tool that is designed to do whatever the end goal is that you're trying to do. Planner should not be a starting point for this sort of thing - you want a system designed to handle records and relationships between different record types, so either something out of box that already does that, or a Power App on Dataverse or SharePoint is probably going to be your best bet.
I'm receiving a Token ',' expected error when creating the fnQueryAllLists in the Advanced editor. The error is on the second Source. What am I missing? let Source = (InputURL) => Let Source = OData.Feed(InputURL & "/_api/web/lists/", null, [Implementation="2.0"] ) // Error is on this statement. In Source in Source
Never mind. I'm a newbie to power query. It's case-sensitive. 'In' is not the same thing as 'in'.
Thank you for this video. I'm trying to use this workflow to get group members from a security group in Entra. I'm hoping this will work. I think I added the Append to array variable groupMembers the way you described, but I'm not sure since I can't see the detail in the video. I keep getting a error message that says, Enter a valid JSON. Is this correct? { "upn":"@{item()?['userPrincipalName']}", "userid":"@{item()?['id']}", "groupid"@{item()?['id']}", "userrole": "Member" } Any ideas? Well, I answered my own question when I pasted my action here. I missed a : and " on groupid.
Wow, this was so much easier than i thought it was going to be! Thanks for the fantastic explanation, it really saved me a lot of time at work :)
This was a great Video. Thanks for uploading it. I am still new to Power BI but wanted to know if it was possible to set this up a template or model for future surveys? I'd like to spend time positioning graphs and charts, but can it be re used for a new survey. It would be the same exact one, but new answers from say a different department. Or will the fact that we need to create a new non table version of the data cause issues? Thank you.
How you set it up depends on how much manual intervention you're ok with. The least intervention would be the SP folder connector for Power BI, where it will pull all files in a folder. You can add filters to that for the file type, path, naming convention (e.g. contains "survey"). As long as you're using "unpivot other" and selecting the fields that will be the same every time when you unpivot the rest, it will be able to pull in all the data into one table. You'd have the filename associated with the survey, which should have the survey name in it to help tell responses apart. If you wanted to transform that to be a bit friendlier format you could split off the extension or something in the query editor.
This is a great tutorial on how to dynamically email employees their personal records. In my case, I have two employees associated with the same record (meaning I have 2 email columns in the dataset). How can I dynamically send a single email that is received by both employees with their shared records? I'm sure that's a loaded question lol but a nudge in the right direction would be extremely helpful. Thanks Christine!
Thanks! I would just add the second column to the table, update the query in the flow, and drop the second email address column in the CC on the email (or semicolon after the recipient). As long as there’s always someone in the first field, that should work.
@@bi-ome Thanks for the response! I think I understand what you are saying, but my problem is that the second email will not always be paired with the first email. For example, user 1 could be paired with user 2 on two orders, so one email total would be sent to both of them. Then user 1 could also be paired with user 3 on an order, so one email total would be sent to both of them. In total, only two emails should be sent.
@@TJKubiesa If you are trying to send them a record set, and the second email address field is not the same every time for a single email recipient 1, you would need to just send that second person a separate email with "their" records assuming don't want them to get some stuff that's not their own (just duplicate the table/copy query - can do a new flow or put it in the same flow).
Is it possible to add the email itself as a attachment in the planner task? i only find videos where the attachment of the mail can be imported, but i want the whole email :/ the reason why is that i can click on it and answer directly and write a mail... do you know that? :)
I'm not sure what you mean, like attach an .eml file? That would be the file type of the email. You might try something like this, but attach it to the task instead of SharePoint: powerusers.microsoft.com/t5/Building-Flows/Flow-send-a-mail-and-save-it-as-EML-in-sharepoint/td-p/897748
Thanks a lot! really helpful and concise!!
Hi, your videos are fantastic! I was after more details on the file statistics on file level in Power BI. So how many views and unique views of example pdf, excel files from a specific site?
The usage data isn’t super accessible to us - my understanding is you pretty much have to get it from the activity API, either with PowerShell or another tool that makes API calls, and store it somewhere yourself (the data only goes back a short time, so it takes a while to build the history). You need pretty high permission in M365 to pull that too, something like compliance admin or global admin. 😅
How can we change the code to personalize the color of each phase of the project ? Thank you.
That’s what we do in the video. We exchange the default colors for our own colors here - just keep following the same pattern for however many buckets you have using the hex color codes.
Excellent
any idea how to customize the order of the phases?
I think it’s alphabetical by default, so super easy way is to just tack a number onto the front to force the sort. Otherwise you can try setting a custom sort order by sorting the bucket column on another column in column settings (so add a second custom column with numeric values and sort on that).
Amazing thank you so much - so useful!!!❤
I cant expand my assignees more than once, I dont understand what Im missing :(
Does it give you the columns to expand? If not check your step that is appending to the assignees variable and make sure you both have it structured the same and have the right dynamic content inserted. Typos in the array will break it too.
@@bi-ome I went back and watched everything and saw I missed one teeny detail "," its fixed and running! Thank you SO much!
What font are you using? I love it!
Thanks! Always Segoe UI haha. Semibold or normal, never full bold. This feels like a twist on a coffee commercial now…
@@bi-ome thanks! For some reason your segoe looks better than mine. Ha!
This must be the first video I've seen that has helped me understand RLS. Thank you so much :)
Glad it helped!
Really awesome tutorial here. Thank you! Is there a way to pull in a link to the the Planner Board and Task for each task so someone using the Power BI report can click and go edit the task/subtask? I realize this is a bit silly/redundant but I expect this will be a useful feature.
Yes, I think that is covered in one of the videos - at least for the tasks - I can’t recall if it was this one, will try to find it 🤣. You can use the same technique for the plans though. We use the plan and task ID columns to concatenate a link to the task in Power Query; you can use that with conditional formatting settings in the table to make the task names clickable.
Okay so I might be losing my mind, I swear I recorded this but can’t seem to find it in any of the videos - all you do is open one of the tasks in Planner and copy the URL, remove the plan and task IDs from the URL and insert the fields in their place in PQ. Double quotes around the strings, & symbol between that and the column inserts to concatenate. If you put it in a matrix you have to use the url icon feature, table will let you make the task names clickable instead.
This was a huge help on getting the sorting right! Thank you!
Awesome!
Super helpful! Thank you!
How has this video not got more likes? Admittedly realising there is a need to see Planner in PBI is a niche, and just following, never mind understanding, the steps is a feat (I only managed to succeed after 4 attempts and only with the video set to 0.5x speed). This is a uniquely brilliant YT tutorial delivery. I know it's unique because after my 3rd failure almost broke me 😊, I was hopelessly scrabbling around the internet looking for an alternative. There are none. This is the way!
Ha! Thank you for your kind words. This process also almost broke me, I had to re-record and republish it at three times figuring out all the pieces to get it right. It frustrates me that it’s this complicated as much as it does you, trust me!
@@bi-ome I totally trust you. Its clear there's no more or less process info here than is needed. Its so well presented. And so hard for the novice to follow- Power Automate is not easy. The persistence pays off though, so thanks again for your willingness to share this info!
Thanks
Hello! I´m using your solution, but I can just get the first 400 lines, and I have more than 500 items in planner. How can get those lines?
Turn on pagination in settings for the “list tasks” step and set the threshold above your total-
@@bi-ome That's what I thought, but it won't let me insert it... Thank you very much!
@@bi-ome I was doing something wrong, it accepted the value now... thanks again...
I have errors in the overdue column
Yeah sorry you have to provide more context if you want help with that, like your formula and/or the error message
@@bi-ome Expression.Error : Sorry... We were unable to apply the < operator to the DateTime and Date types. Détails : Operator=< Left=21/06/2024 12:00:00 Right=14/06/2024 ******************************* if [value.dueDateTime] = null then false else if DateTime.Date(DateTime.LocalNow()) > [value.dueDateTime] and [value.percentComplete] <> 100 then true else if [value.completedDateTime] > [value.dueDateTime] then true else false *******************************
example : value.percentComplet : 0 value.StartDateTime: Null value.createDateTime: 30/04/2024 value.dueDateTime:21/06/2024 value.completeDateTime: null value.checkitemlistitemcount: 0 value.activechecklistitemCount:0 Late: Error
@@profundone5149 One of your columns looks like date and the other datetime - they both need to be the same type to do the comparison. You can select the column, right click, and change the type to match (make sure you do that before the comparison step).
@@bi-ome All the columns are only dated
Excellent.... the Gateway thing has foxed me for some time. Thank you for sharing your knowledge
I get an error message when I try to save. Says that I need to enter a valid json. Any ideas why?
This is under the Append array variable
Sounds like your JSON has a typo or something missing. There are JSON validation tools online, you could try pasting it in there and see if it will pinpoint the place where the issue is
very helpful and straight forward
This made it so much easier after struggling for hours. Thank you!
Pretty AWESOME, thank you!
First of all big thank you for that video, I would never imagined how hard it is to get Planner data ready for PowerBI. There is one issue I have after I added the bucket information later to the already created Power Automate flow. While adding the "buckets" to the "Append to array variable PlannerData" step, I do not get the "Compose filter buckets" Outputs in the dynamic content for selection. It is just not there. What could be the reason?
Make sure you're not using the modern UI - there's a toggle to turn it off in the top toolbar. A lot of the dynamic content isn't in modern. Also make sure it's nested in the same place as in the video, if you have it misplaced inside or outside the loop it needs to be in it won't show up--
@@bi-ome Thank you Christine, it was nested wrong so it couldn't show up.
your video is really detailed and helpful thank you so much for that. But is there a way we can also get the Priority filed of a task in our power bi
Yes, I go through that in the Part 3 video - it should be linked in the description of this one :)
I watch your videos all the time and they really help. Thanks!
This is THE best video on Power BI RLS! Thank you!
thanks! 😄
Nice video. Please how do we get the file path for a sharepoint list? The data used to build the power BI dashboard was collected using microsoft forms and stored in excel file. Now a sharepoint list has been created with the same data in the excel. We need to switch to the power bi source to the sharepoint list without the need to start developing the report from scrach
It's yourtenant.sharepoint.com/lists/listname, but if you are moving from Excel data to list data the structure is likely to be very different so you'll probably have to redo a lot of the query steps. They're not interchangeable like the file paths, and the references likely won't map properly... switching file paths works because the underlying data structure is exactly the same.
Hi Christine, this seems like exactly what I will need but when I plug in the DAX query and test it, the output is just [], which obviously is hard to parse as a JSON! Any idea why that might be? The dataset updates daily and should be pulling 8 columns and two rows today. Is there some security level on the PBI side I should be aware of?
It sounds like your query is returning blank - does the account that's running the DAX in Power Automate have permission to view the report? I would double check that the DAX is actually evaluating
@@bi-ome It is all through my account. I fiddled with the filters on the visual in the end and got it to work. No idea why it wasn't working before but happy it seems to be working now! Thanks so much!
I was able to replicate this process so this tutorial definitely works. I'm pretty new to powerautomate and was wondering how I would alter this process if I wanted to populate a single email with two different tables? Both tables include the same field being used to send the distinct emails.
Personally I would just tack on another column to the same table we used in this tutorial for your second table, and use the same technique. That way when you query your dataset, you have both tables available to you as dynamic content cards in the same output - you can drop them both into the email in the loop. When you update your visual, make sure to re-copy the DAX query and paste it into the "query a dataset" so that it gets both of the table columns. :)
@@bi-ome That makes sense. Thanks for your help.
Big like for explaining how it's done within the first 8 seconds. Haven't seen such conciseness on youtube since forever
Been trying to download the Gant.pbix file but it's not downloading. Please, has anyone also experienced this issue? what do i do??
Awesome, simple & educative Thank you!!
Great video Christine! It gave me a great lead on my issue! Do you have any idea how I change this to send a scheduled email that contains a CSV file with all the data in a table? in Table format inside the CSV. Like, if you have a simple table with headers and you want to send that in a scheduled email. I used the DAX to get the columns I needed but can't populate the CSV in table format (only getting a CSV with all the data in one row...) I'm searching online and can't get an answer for this... TIA!
Thanks! A csv is a file with all the data (comma-separated values) in one row - it’s only when you open it with Excel that it’s a table. But the ‘create CSV’ action will create a CSV and you can use the create file action to create the csv file in SP. Make sure to remember to put .csv at the end of the file name in that step. If you’re making a CSV, don’t use HTML tables like in this video btw, just use plain data rows. :)
@@bi-ome Yesterday I was finally able to create the CSV with a table inside it! I used a combination of 3 videos with one of them is yours! Thanks so much! I love your on screen notes! Very helpful!
Hello, first I would like to thank you for the excellent content. I'm trying a problem and I'm not able to solve it, if you can help me I'll be grateful. By zooming in on the graph visualizing the days, we can see that on weekends (Saturday and Sunday), it is shaded. However this shading for me is getting on Sunday and Monday, would you know how to help me to correct this? Thank you in advance
Answered this here, cross-linking in case someone else has the same question: www.linkedin.com/feed/update/urn:li:activity:7198339576996720641?commentUrn=urn%3Ali%3Acomment%3A%28activity%3A7198339576996720641%2C7204854094455287812%29&replyUrn=urn%3Ali%3Acomment%3A%28activity%3A7198339576996720641%2C7206439406449090560%29&dashCommentUrn=urn%3Ali%3Afsd_comment%3A%287204854094455287812%2Curn%3Ali%3Aactivity%3A7198339576996720641%29&dashReplyUrn=urn%3Ali%3Afsd_comment%3A%287206439406449090560%2Curn%3Ali%3Aactivity%3A7198339576996720641%29
Thanks for your time/help! Also, saw your reddit acct in your Gantt video and realized you've helped me on there too 😭
Aw thanks haha!
Fantastic Videos Christine, these are super useful! I was wondering in the interim of custom columns (hopefully) getting added to dataverse 🤞, is there a current workaround to be able to grab this data at all? This would be absolutely perfect if possible, Thank you!
Thanks! Not that I could find… which at that point makes me kind of just want to make my own app, and use Power BI for the Gantt, but that’s a can of worms. Someday if I ever have massive amounts of free time…
Thank you!
Amazing work, It is possible to modify the gantt for calculate the days for each task based only in the work days ?
Yeah, if you're using a date table or something you can filter out dates. So if you make a measure or calc column that gets the duration you want, you can just slot that in place of the old one, just make sure it's named the same thing.