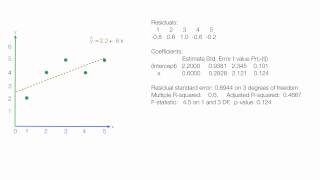
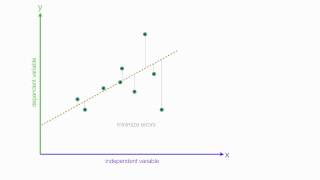
How to calculate a Regression Equation Using Excel Statistics

HTML-код
- Опубликовано: 22 авг 2024
- Using Microsoft Excel to calculate Standard Deviation, Mean, and Variance, Presented by David Longstreet
Like us on: / partymorestudyless
Playlist on Regression: www.youtube.com...


Happy to save you :). I added a link to an entire playlist on regression in the description of this video. This video is one of my older ones and I have revise and improved the newer ones on regression.
Good luck in your class!
thank you so much! you saved me from failing my homework! you do so much more than we cover in class. and I understand it now :)
Great to hear things are better.
Thanks for the compliment. Make sure you look at the playlist on regression on my channel statisticsfun.
You are very welcome. Make sure you like MyBookSucks on Facebook (see link in video description).
Hello!
Firstly, thank you so much for making these videos!
Secondly, I was wondering what the criteria is for choosing your initial x and y variable. If I want to predict the number of tea gallons that will likely be sold, should I use the number of people who walked in the store on the same day last year? That does not seem to be correct to me, but I'm not sure what else to predict such a thing off of.
Whether or not you answer the question, I appreciate your time!
Appreciate the feedback.
1. It could be you need to increase the width of your excel column.
2. You may need to reduce the number of decimal points.
You can attach your spreadsheet or a photograph of your work on messages on MyBookSucks FaceBook fan page (see link in the description of this video). I will look at it and see if can't figure out what you are doing wrong.
you are a hero, thank you sir
Thanks for video. Very helpful
thank you for posting this!
Thanks for the tip!
Just to make things easier - if you want to keep some cell constant in a formula in excel, you don't have to put there mechanically $ signs, just hit F4 key and the computer puts the signs there for you ;-)
Thanks for the video. Please explain how to check significance of r2 or r.
You can see a complete playlist on Regression and I explain R squared in one of the videos. ruclips.net/user/course?list=ECF596A4043DBEAE9C
Ok thanks. Your videos are nice and understandable.
I want to ask if slopes of two or more than two regression lines (b) is possible to compare by t-test or Ancova.
Thank you sir very much
love you
Amaaaazing
love you