Excel 2016 Data Analysis ToolPak Histograms and Percent Polygons

HTML-код
- Опубликовано: 24 янв 2017
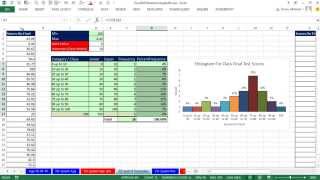
- This how-to walks you through the process of using the Data Analysis ToolPak to visualize data distributions. This process is different from the pivot table method and provides results that are more easily compared. I detail the process of generating a histogram for each outcome and a plot of several percent polygons to compare several distributions.


Thank you. This is the best tutorial on histograms on Excel and so well presented.
Thanks for the love.
This video has been really helpful, thank you for uploading
SUPERB. very clear and complete too.
Glad it was helpful!
Ok... How about sharing the data-file? So that we can work in parallel...
This was meant to be a demo, but I will look into sharing the file.
Even in HD, the video resolution is too low to read much of the font for some of the functions; that or the text is too small.
.
The screen on my laptop is pretty sizable; when the video is only partly filling the screen, the text is too small, and when it's full screen, the resolution at times is too low.
.
Still very helpful overall though.
It may be the speed of your internet connection. Are you using listening along, because I also spell out the formulas used.
Here is a link to the data: faculty.sfasu.edu/phelpsrt/youtubefiles/Percent_Polygons_DAToolPak.xlsx