Hypothesis tests on one mean: t test or z test?

HTML-код
- Опубликовано: 9 сен 2024
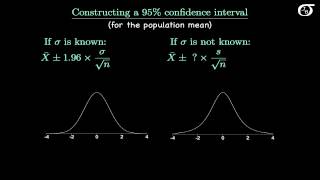
- A look at at what influences the choice of the t test or z test in one-sample hypothesis tests on the population mean mu. I work through an example of a t test, and compare the p-value of the t test to would have been found had we (incorrectly) used a z test.


this man is the only reason I am not gonna pass/fail my stats class
ur a life saver, i was trying so hard to find out the true rules of using t and z values
I'm glad to be of help.
How did you get the p-value?
Thanks!
I do everything on a Mac. The underlying presentation is done in Latex/Beamer, and I record and edit in Screenflow. It doesn't take too much to get up and running at first. But I've definitely learned a lot as I've gone along, and refined things quite a bit. Best of luck!
You are an awesome teacher. Gifted I would say! :)
First of all, thank you so much for sharing knowledge, for free in your videos! I should say, I always enjoy and learn from your videos!
However, I have a few questions:
1. I couldn't see the significant level to set up your rejection area in the question. Which one did you use here?
2. Assuming you have chosen the 'usual/traditional' one of 5% (0.05), how did you come to reject Ho based on P-value (0.568) you obtained in your calculations? (When P-value is larger than significant level, your t-statistics tend to fall in "fail to reject area of Ho" that is: Ho= hypothesized mean).
I would appreciate for any insights from anyone here.
Thank you!
As a general rule I don't use the rejection region approach, even when carrying out a test at a fixed significance level. I think that since the p-value approach leads to the exact same conclusion at a fixed significance level, but gives you the p-value, and the p-value is typically reported by software, that's the better path.
Here I was illustrating the difference between t and z tests, in inference for the mean of a normally distributed population. I wasn't getting into the details of hypothesis testing beyond that. It was a fabricated example to show there can be meaningful differences between the t and z, even when the sample size is not all that small.
But to address the big picture idea of what you're asking here, in the vast majority of hypothesis testing scenarios no actual decision is being made. Sometimes there is, and if a decision is being made solely on the results of the test (e.g. tossing an explanatory variable out of a multiple regression model in a backwards elimination procedure, say), and so then we need a rule. In the vast majority of cases, no actual decision is being made, and I think it simply doesn't make sense to impose an arbitrary decision rule in spots where no decision is being made. Imposing a binary decision on what is in reality a continuum , where no binary decision is necessary or needed, is not the way to go.
Under the assumptions of the test in this video, if H_0 is true then the p-value has a uniform distribution on (0,1). We'd see a p-value of 0.568 or smaller more than half the time if the null is true, so there's no evidence whatsoever against H_0. There doesn't need to be an arbitrary decision rule to come to that conclusion.
Much of this is opinion, and we could debate the nuances of hypothesis testing for the next century, as has been done for 1+ centuries. But I'm pretty sure that on my deathbed I'll still think that's a crime against science that everybody got fixated on acting like we're making a reject/don't reject H_0 decision at 0.05 as the default way to go about things.
@jbstatistics
I appreciate you taking the time to explain that to me. What a selfless character you have! Respect!
I believe that, just like your other videos, this explanation will help many people, not just myself.
Thank you again, and keep up the wonderful work! 👏
@@BNT05 Thanks for the kind words! I may not be selfless, but I do truly want to help people learn :)
@@jbstatistics
And you manage to do magnificently, imo: 😊
Thanks for the compliment!
You are very welcome.
Very good video!
How do you make your videos? It is not PowerPoint is it?
I teach at a college and will be teaching an online course and would like to make videos like this one.
Excellent explanation. Thanks for posting.
thank you very much, it was a bit confusing when i thought about the sample size, but thanks for clearing it up
wow, i understand it now. thank you very much!
5.7% versus 4.9% - not insignificant, though, conceptually, a small difference.
Thank you for sharing this video - I found it to be very helpful.
I'm glad to be of help. The difference is often small, but I don't think that's a valid reason to have that error in there :)
Wow that is a very strong statement. But when n > 30, there isn't THAT much harm that could be done by using the normal distribution. The t table is a pain in the ass to use as the areas are limited. Probably why people try not to use it unless they absolutely have to.
I agree. If your sample is large (~1000) just go with z
Thank you so much for this!
> Be a Stats professor
> Students asking for suggested online videos for clearer explanations about which distribution to use in word problems
> Not sure what's unclear but okay
> Tons of videos where they say to use z-test any time n >30
> UGGGGGGHHHHH
> Find this video, go to 2:21
> THANK YOU!!!
You are very welcome Scott! As you can probably tell from how I phrase it in this video, the "n > 30"
thing that many focus on makes me angry/sad. Cheers.
Thank you so much for making this video!
Does one need a level of significance (alpha) to get a p-value from the table? How are you getting the 0.0568 from the tables?
we were taught that if sample size exceeds 30, we should use the z-score... can you pls expatiate on this pls...tanx
I feel that I do address this in detail in this video. Starting at around 2:20, I explain that some sources use the n > 30 rule, I say that I don't agree with this approach, and then I illustrate why I feel it's not a great approach. Was there some specific part of that discussion that you weren't following or found confusing?
nope, got you right, does that mean if i use a z test id still arrive at the same answer....im asking cos i have exams tomorrow, hoping you re not offended by my request
If you're trying to get the highest mark on a test, do whatever your professor tells you to do. I don't know how your prof designs tests, or what he or she considers right or wrong. The reality of the situation is that if you use a z test when you should be using t, even for a larger sample size, then the p-value you find will be a little off. Cheers.
Great explanation but how do I calculate the P-value on TI-84?
thx a lot for the explaination, but i got a question. can i substitue μ0 for xbar when calculating s? (since i have made the hypothesis that μ0 is the mean)
Can you send the t table you used to find the p value
Pls send link for the t table that you use
Thank you so much for making this video. Dun think I am ever gonna figure out my biostatistics notes without your help
I'm glad to be of help!
U should get more views and more popularity
thank you so much, you have helped me for the final exam .. haha
HELP?
So if we can't use the sample size to determine whether to use a t Statistic or Z statistic then what should we use? Can't find this in your follow up video
The entire purpose of this video was to discuss that. That's what this video is about. I have a detailed discussion about it here. Then I say the decision shouldn't be based on sample size. It should be based on the notion that I discuss in the video (whether the population standard deviation is known (almost never), or whether it is estimated from sample data (almost always)).
I apologize I guess I didn't catch that in the video. How can we determine whether to use z-statistic or t-statistic if it isnʼt clearly stated in a question what the population standard deviation is?
@@irafundafunda2898 In my videos I discuss the reality of the situation, and not various ways of answering questions depending on the wording. How best to answer a question depends on its precise wording, and also the beliefs of the questioner and grader.
All that said, your question doesn't make sense and is not answerable as stated. If you mean instead "how would we tell if the standard deviation given in a question is from the population or from the sample?" then that depends on the wording of the question and on the beliefs of the person who wrote it.
@@jbstatisticsOkay I see.
Thank you for this explanation. What is the best way to contact you? Thank you once again.
Thank you so much .
You are very welcome!
i need more about null hypothsis
thx for ur effort man we really appreciate it, but i have a question about the sample size required for the hypothesis test and if there is a formula for every case to determine it?
I'm not sure what you mean by "the sample size required for the hypothesis test". Conceivably we could carry out a hypothesis test on a mean with a sample size of 1 (if we knew the population variance sigma^2.) If you're asking about calculating the sample size to achieve a given power of the test, then I don't have a video that looks at that directly. (I have videos that look at the relationship between sample size and power, and I have a video outlining how to calculate the sample size for a given margin of error for a confidence interval.)
jbstatistics i got the whole picture now , thank u for ur reply
Where do you get the p value ?
So basically z-test is useless? Because normally we don't know the std of the population?
So fucking damn helpful!
What if the Sample standard deviation is not known?
+Dave Pennock The sample standard deviation can be calculated from sample data. If there is no sample data, then you wouldn't have any information and you couldn't carry out a test.
4:38
anyone else having trouble with the audio?
Kelsea T no
HELP
i hate stats
Too many jargons but i got it with repetition and other similar videos.