@DanYasaki is this then showing a negative relationship since as X increases the f(x) decreases? BTW thanks I have not done a regression analysis in google sheets yet and I have to say I really like drive and the apps and your video was super to the point!
Thank you for the video, but I want to know if I could change the significant figure (more decimals) of that slope and intercept in Google Sheets.. do es enyone know how to do it, please? (i.e. m=1.0241 insted of the given 1.02)
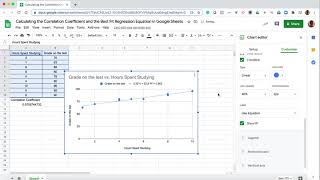
I have not tested it, but here is what I found. The equation in the legend may not include enough decimal places. If this is the case for a linear trend, the SLOPE and INTERCEPT commands may be used to calculate the slope and intercept of the trend. For this data, we would write =SLOPE(B2:B6,A2:A6) scholarlyoa.com/regression-using-google-sheets/ or =INTERCEPT(B2:B6,A2:A6) in a cell. Note that each of the functions require the range of the dependent variable to be listed first (B2:B6)and the range of the independent variable second (A2:A6). (scholarlyoa.com/regression-using-google-sheets/)


![Megan Thee Stallion - Mamushi (feat. Yuki Chiba) [2024 London Performance]](http://i.ytimg.com/vi/pxTCJUuorKc/mqdefault.jpg)


thank you!! you saved my ass for this damn chemistry lab report
@DanYasaki is this then showing a negative relationship since as X increases the f(x) decreases? BTW thanks I have not done a regression analysis in google sheets yet and I have to say I really like drive and the apps and your video was super to the point!
I thumbs up because this was to the point
how can I plot multiple regression lines? 3 sets of data on one graph
thumbs up, thank you very much !!!
Hi Dan, very informative video. If x is 15 (demand) how do I insert 15 into the equation on the sheet to obtain the corresponding price?
It was easier than I thought
Thank you for the video, but I want to know if I could change the significant figure (more decimals) of that slope and intercept in Google Sheets.. do es enyone know how to do it, please? (i.e. m=1.0241 insted of the given 1.02)
I have not tested it, but here is what I found.
The equation in the legend may not include enough decimal places. If this is the case for a linear trend, the SLOPE and INTERCEPT commands may be used to calculate the slope and intercept of the trend. For this data, we would write
=SLOPE(B2:B6,A2:A6)
scholarlyoa.com/regression-using-google-sheets/
or
=INTERCEPT(B2:B6,A2:A6)
in a cell. Note that each of the functions require the range of the dependent variable to be listed first (B2:B6)and the range of the independent variable second (A2:A6).
(scholarlyoa.com/regression-using-google-sheets/)
Thank You!!!
thank you
Incomplete video about linest...you better read the help file.