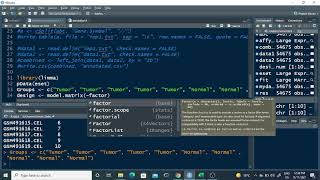
Microarray data normalization and annotation - R tutorial

HTML-код
- Опубликовано: 1 ноя 2021
- #Rstudio #RMA #Annotation
For Bioinformatics and NGS Analysis services please contact farhan@jgiconsulting.pk
visit: jgiconsulting.pk/overview/
#Bioinformatics #R #Microarray #Datascience #expression #RNA #tutorial #Easy #Guide #Affymetrix #Pakistan #USA #English #UK #England
Blog: farhanhaqjahangiri.blogspot.c...
RUclips: / farhanhaqj


allah bless you with unlimited success sir
JaxakAllah
waiting for next part of microarray data analysis.
Thank you very much! It was incredibly helpful
Nice
This is splendid👍👍
Thanks
Great video
Thanks!
Do you have a video that explain how to do the quality control of the raw data in order to see the outliers etc.?
Thanks for such a wonderful and patience video! it really saves me lots of time, thank you again!!!
You're welcome!
Very good content, thank you.
Do you know how I can work with the GSE27813 dataset?, as it has no -.
.CEL files but only the normalised and non-normalised tables, how can I load the second one to normalise it myself.
Thx for the awesome content, could you please send us the bibliography that you used for do this analysis ?
How to generate heat map and volcano graf by using r studio in cancer genes
is read.celfiles function available in r4.2.2? I tried to download the package, but it says it cannot download nor find the function..
Please make vedios using ML and artificial intelligence in molecular biology
Do you know how to normalize RNA-Seq data using R?
How can one normalised Agilent data with.txt.gz file format
Your mydata file showing 54675 obs with 7variable.. While mine is 6105616 obs with only 1 variable.. I am using same gsm and . Soft file used in this tutorial
Salam dear Farhan, guide me please in creating Seurat object in R of SCRNA Seq data of ArrayExpress like E-MTAB-7704. Thanking you in anticipation
very useful video and very well explained thank you :) i would like to ask if this method only applied to microarray affymetrix data? if i apply the same to illumina microarray data would that be wrong? thank you!
No. You need to use the soft file of Illumina. Else would be fine
I can't thank you enough for your informative video! I just have a question, I'm using my own cel files (generated by GeneChip miRNA 4.0 Array) ... where can I download the family.softl file?
Thank you so much in advance!
You may go to GEO NCBI. Search this platform and then open any study related to this platform. You can find the family.soft file at the end of the page along with other file for the same study.
When I do same for my soft file, I am getting error sir, it seems doesn’t have gene symbols and I’d . GSE162860
Dear Farahan thank you for the informative video. If I am using my own cel files which are generated by clariom S Affymetrix gene chip from where i can get the family.softl file.
Check GPL26070
@@FarhanHaqj thank you for your response will check it.
Can we able to analyse .cel files with DEseq 2 package.And how can I retrieve gene symbol from the ref id or probe id of .cel files in DEseq 2
Deseq2 is meant for count data and it should not be applied on microarray data
@@FarhanHaqj oke.suppose I want to see the common DEG between two dataset.One dataset is count data and the other dataset is for microarray data.So can i perform two different package for these two dataset to find out common DEG individually from that??I mean for microarray the limma package and for count or RNAseq data the DEseq2 package?
@@johirislam8174 yes
@@FarhanHaqj I am very confused about the microarray data and count data.Can you kindly explain this?
Help
Hello farhan haq. thank you for your detailed explanation. I have a problem, as you explained I tried to split the slashes but i get this error:
columns not found: Gene.Symbols
I have searched lots of forums and websites but I have not found a solution yet.
I am a newbie so I'll appreciate if you help me.
Check the header of your file. I think Gene.Symbols may be written differently in your file. Maybe there is no "." in the file or may be there is something else written there. It seems there is no problem with the code, thats why you are not finding any solution online.
Good luck
@@FarhanHaqj Thank you for your reply, but I have the same data set as the one you are using in this video. I have been doing almost everything you said in the video but still there is the error. what happens if I skip this step?
@@hhhh56hh545 You have to open the file and delete the data until the columns ID GB_ACC SPOT_ID etc, in order to have only the columns and probe id.
How we can use random forest in GWAS studies
You may check my random forest video
Thanks for the video. I have a data from GEO but the data is in .txt. How can i run normalization for this?
Is it Affymetrix data ?
@@FarhanHaqj It's agilent microarrays
@@Nadia-db6nb This tutorial is for Affymetrix. Agilent workflow should be different. Please check this www.biostars.org/p/388949/#388960
Hello sir, it shows an error that I have no gene.symbol in my files.
So change it with any identifier you want to annotate. Like entrez ID etc
Hello, when i come to the point to use the Csplit function, i get an error :Error in `[.data.table`(indt, , splitCols, with = FALSE) :
column(s) not found: Gene.Symbol
What could be the problem??
Genesymbol colum is not present. Open the file and put this in header
@@FarhanHaqj I have opened the file and the Gene Symbol column is present. I do not know what is the problem
@@user-rf1nr1em3c hello..did u get rectified your error.. itoo face the same error
Please provide the code pls
Unfortunately not. I have found another video with another tutorial that worked for me@@shahidhafathima6153
My data
Give the address of the soft fike
File
GSE45830 file
ftp.ncbi.nlm.nih.gov/geo/series/GSE48nnn/GSE48350/soft/
@@user-pw4fg2sx5n yes
Every time I see any R code, I get thankful to know Python. Sorry, guys. 🙂
However, transcriptomic and genomic analysis libraries are mainly developed in R. That's the limitation of python