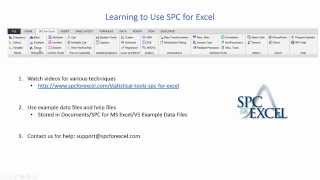
SPC for Excel is a software program that is simple to use, but contains a multitude of powerful tools and charts for a full range of statistical analysis. Learn more in our informative video. ruclips.net/video/rNsY0Blhrs0/видео.html
Since this video was produced, we have added both Poisson and Binomial process capability analysis. There are no real differences in the output between SPC for Excel and Minitab. SPC for Excel has Cpk analysis, ability to produce multiple Cpk charts from a table of data, non-normal Ppk, Poisson and Binomial capability and snapshot that includes Cpk/Ppk analysis, individuals control chart and normal probability plot.


SPC for Excel is a software program that is simple to use, but contains a multitude of powerful tools and charts for a full range of statistical analysis. Learn more in our informative video. ruclips.net/video/rNsY0Blhrs0/видео.html
Is this software for bpth continuous and discrete data as well? What are the differences from minitab?
Since this video was produced, we have added both Poisson and Binomial process capability analysis. There are no real differences in the output between SPC for Excel and Minitab. SPC for Excel has Cpk analysis, ability to produce multiple Cpk charts from a table of data, non-normal Ppk, Poisson and Binomial capability and snapshot that includes Cpk/Ppk analysis, individuals control chart and normal probability plot.
How you add menu (spc for Excel)
You use a program called Custom UI Editor for Microsoft Office. Search on line for it.