Weibull Distribution Probability Plot

HTML-код
- Опубликовано: 21 авг 2024
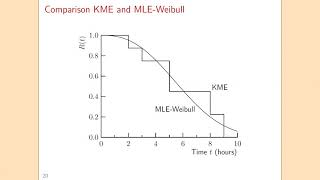
- In this video, I present a technique to model data with a Weibull distribution. I show how to acquire the best fit Weibull distribution from a data set using a probability plot. Then P10, P50, and P90 is determined from the best fit Weibull distribution in excel.


Thanks a lot for sharing this video.
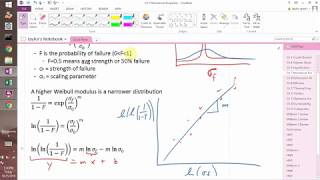
can i plot log of time on x axis and lnln(1/1-f) of stress on y and take a weibull destribution
👏🏻👏🏻👏🏻👏🏻👏🏻👏🏻👏🏻❤️🌹
there arent weibulllnv function in excel, how to add this function ?
did you get it, i am facing the same issue
How do you get this function to appear in excel?
Please, it is possible to send me the Excel file.
weibulliinv fiucntion in not found
Hallo bro