can you please show any reference in support of the method of your first VIF calculation formula. I have found two different results using the two formulas and everyone supports the later one (with R square).
Quite straight forward though excel wouldn't let me run the regression as I have panel data. The S2 denominator was obtained prior to making the video so clueless on how to work out ANOVA
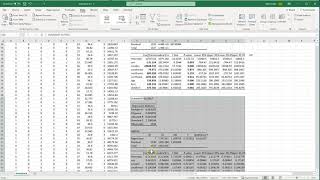
at 5:12 you should devide by overal standard error in Cell B7 instead of mean squars of the residuals in cell D17 Can you confirm this is right? When I know use both formulas, I have both times the same answer please correct my Enlisch writing....


Thanks for this in-depth video on how to format in Excel.
thank you so much. I am doing a thesis in social sciences so had to regress my data. I followed your steps (even the editing) and it worked perfectly.
I got a perfect score on my homework and saved 45 bucks on phstat thank to this video, thank you very much
I got a perfect score on my homework and saved 45 bucks on phstat thank to this video
Exactly what I was looking for! Thank you!
Many thnx for such nice n illustrative vdo upload.
Fantastic video. Kudos to you.
can you please show any reference in support of the method of your first VIF calculation formula. I have found two different results using the two formulas and everyone supports the later one (with R square).
Great Video! Do you know where I could Reference this formula?
Quite straight forward though excel wouldn't let me run the regression as I have panel data. The S2 denominator was obtained prior to making the video so clueless on how to work out ANOVA
thanks for the explanation
I did a different regression myself
Do you know why the VIF different so much between both formulas?
Kind Regards,
René
When you selected total observatoins you selected from the anova table which is # of observations - 1. Is that right?
at 5:12 you should devide by overal standard error in Cell B7 instead of mean squars of the residuals in cell D17
Can you confirm this is right?
When I know use both formulas, I have both times the same answer
please correct my Enlisch writing....
dear god man you and your decimal places
Than you so much, it's a wonderful work!!!
Good job bro!
Don't spend half a tutorial video formatting your document, people want to see the process
Thank you!!
O caca!