Power BI - How to Calculate Month on Month Growth %

HTML-код
- Опубликовано: 17 авг 2023
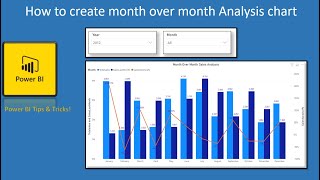
- Power BI Tutorial on how to calculate month over month growth % using DAX. This is helpful whether you are improving or declining on a monthly basis.
We can achieve this using calculate function, dateadd function and divide function.
Dataset link - tinyurl.com/yd65vnf3
For advance dashboard training or consulting, contact - abhishek.agarrwal@gmail.com
Google sheet - docs.google.com/spreadsheets/...


Hi, Thank you for your videos.
Is there a video on how to create a trend chart for user engagement. I have user_id and event_date in a table and need to plot a chart which should show percentages of engagement(active user) for each month over the years.
Do you have more than one table in this walkthrough because you used column name which isn’t on this current table order ID and order date are two different column not found in this table showing on the tab table view?
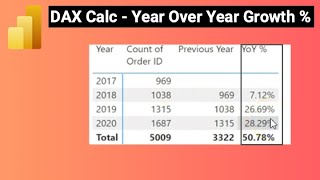
Where did you get the previous month column from? Didn’t see you create a new column or could it be that DAX formula you wrote for the previous month also created a new column for it?
I think I get it the new measure serves as the new column but how can generateseries be used in this instant with maybe date comparisons?
This is what I have been learning on chatgpt which took the route of using generateseries, calculate, comparison etc and your video is so much helpful 😅❤
Thanks 😊
Ty for this!!
Thanks a lot!
How can we Identify the Steepest Downfall Across different products on month on month level on the basis of net sales?
I used exactly same formula but on the table the prev month numbers displayed only for year and quarter.. when I go to month the prev column shows blank however the totals are alone appearing
How to use only growing values? In excel i will use somenthing like "=sum( max( act.month - prev.month ; 0 ) )". But I don't know how to do it in DAX. I need to sum only positve differences of each months, so in your data for 2019 I should sum only March + April + May + September + November... and that show on SUBTOTAL (not 15 = 1315 - 1300)
I hv been trying to plot change percent along with total sales on y and secondary y axis respectively for combo graph where both the axis should start at 0 however for negetive change values the graph on secondary line start from -10 how can i align zero value for both axis? Can you help?
This is great! Could you do the same with a week to week comparison? How would you create the previous week column?
There is a video for Week over week ... just search in the google spreadsheet.
Sir i need ur help if i have 2 columns date and revenue how to calculate
Revenue for the year end assuming 1% decline on a month on month basis
Please
I'm getting data from a future month in last month count. Do you know how to remove it?
Please make a video on how to calculate same period last month growth percentages
thanks for suggestion...will make one
Hi sir, do you provide online training
yes... I have online training from basic to advance power bi course.