Data Science for Everyone 6-3 Data Visualization for Univariate Analysis Part 3

HTML-код
- Опубликовано: 10 сен 2024
- #datascience #datavisualization #boxplot #lineplot
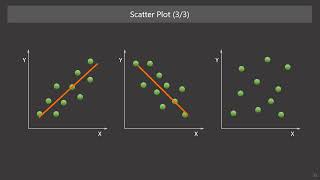
Data visualization is useful to understand and show the whole picture of data. A good data scientist should be adept at visualizing data. This third section shows visualization method for univariate analysis of continuous variables: Box Plot and Line Plot.
Previous: • Data Science for Every...
Next: • Data Science for Every...
Playlist: • Data Science for Everyone
This course is targeted for managers who are not data scientist but need to manage data analytic projects. This is also targeted for managers who want to introduce data-driven management. So, the knowledge provided in this course is both theoretical and pragmatic, but not includes details of mathematics and coding. However, anyone who are beginners in data science are also welcome because this course can provide you with essentials for learning technical aspects of data science.
Takuma Kimura, Ph.D.
Scientist of Organizational Behavior and Business Analytics
/ takuma-kimura-ba6242104


![The most beautiful equation in math, explained visually [Euler’s Formula]](/img/1.gif)