Thanks Krish .Now I am understanding why statistics is important in data science .People often miss this fact and suffer later while on the job.Thanks once again
I think that a simpler way to say is that the covariance is the multiplication of our standard deviations by the number of data. Thanks for your explanation, it helped a lot.
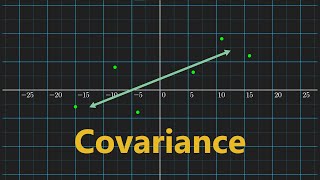
To summarise; if the Covariance is positive, both the variables(size,price) are heading in same direction ie. both are increasing or decreasing. If the Covariance is negative, both are heading in opposite direction ie. one is increasing while the other is decreasing.
Explaination in all your videos is top knotch , I will suggest everybody watching this video to read blogs or articles on same topics , this will boost your clarity abt concepts their applications and examples
@krish When we substitute values in the covariance formula, we do get a finite number (strength) which can either be positive or negative (direction). Because in Pearson's Correlation Coefficient, we take the variance and divide it by SD of X and Y.. when we get the value from covariance, why exactly we need Pearson's Correlation Coefficient?
Covariance doesn't tell us how much are the two variables related, it just mentions +ve and -ve relation between 2 variables. Correlation not only tells us the relationship between 2 variables(+ve / -ve), it also tells us the value of relationships between the two, which might help in determining whether we should keep the Variable or we can exclude them for modeling purposes. I hope this was useful!
@@lokeshrathi5500 i have a little understanding in these concepts. my question is, if we are having a number, then it can have a sign (+ve or -ve) indicating the direction. we cannot have a sign without the magnitude.. this im still not clear.. correct me if im wrong..
In Python you can store any dataset in a pandas dataframe and use the .corr() method in order to see the Person's correlation between all the features. This method will display all the coefficients of every feature by comparing each individual with any other in the dataset.
@@Artificial_Intelligence_AI that .corr() method which you seggested makes the correlation matrix, she was asking how to make the co-variance matrix? I'm not sure, I think there is a .cov() method in numpy
Hi Krish, Thanks for the explanation. I noticed the python cov method divides the variance by (n-1) instead of n, as u have given in the formula for covariance. Can you please tell me why do we consider n for a population covariance and (n-1) for a sample covariance?
Hi, Thank you very much for this video. I really like your videos. I have a question: Cov(A, B)= (1/n)* Sum[(A- avg A)*(B- Avg B)] ==> this is for population or sample ?? If It is sample then a) n =n-1 and b) while calculating the person coefficient the standard deviation formulae should also be n-1 or not? as my person coefficient value is going beyond -1 in a dataset which is not feasible. can you please clear this doubt.
According to me and Krish sir's first video in this particular video, he is talking about "population Mean" reason-> he is denoting through "mu" in this particular video!
Hi..thank you for explaining covariance. Just one question: +ve covariance means X is positively related to y and -ve covariance means X is negatively affecting y. But how can we say that X is NOT affecting y. In your example suppose someone trying to get covariance of floor number and park(just a vague example)
Covariance indicates the direction of the linear relationship between variables. Correlation measures both the strength and direction of the linear relationship
sir can you please make a video on how distribution is helpful in data science??????????? i know normal , gaussian distribution from your video but how these are helpful i dont know any real time scenario how should id use?


Thanks Krish .Now I am understanding why statistics is important in data science .People often miss this fact and suffer later while on the job.Thanks once again
Your videos are good. Please use different colour combination. It's a bit difficult to read.
Best explanation of co-variance in youtube
Sir from today you are a "clarity of powerhouse". Sir what a amazing video it is. God bless you. Keep going higher and higher.
I think that a simpler way to say is that the covariance is the multiplication of our standard deviations by the number of data.
Thanks for your explanation, it helped a lot.
00:10 Covariance
4:50 Importance of Covariance
10:29 Drawbacks
Powerhouse of clarity you are.....such a amazing voice also...thank you so much
To summarise; if the Covariance is positive, both the variables(size,price) are heading in same direction ie. both are increasing or decreasing. If the Covariance is negative, both are heading in opposite direction ie. one is increasing while the other is decreasing.
Explaination in all your videos is top knotch , I will suggest everybody watching this video to read blogs or articles on same topics , this will boost your clarity abt concepts their applications and examples
You guys can simply understand Covariance by remembering this rules:
X*Y
POSITIVE * POSITIVE = POSITIVE(+)
NEGATIVE * NEGATIVE = POSITIVE(+)
POSITIVE * NEGATIVE = NEGATIVE(-)
NEGATIVE * POSITIVE = NEGATIVE(-)
Beautiful video! Going through the entire playlist to revise my fundamentals!
Thanks for video Krish. It was helpful
you are a great teacher krish !!!
@krish When we substitute values in the covariance formula, we do get a finite number (strength) which can either be positive or negative (direction). Because in Pearson's Correlation Coefficient, we take the variance and divide it by SD of X and Y.. when we get the value from covariance, why exactly we need Pearson's Correlation Coefficient?
Covariance doesn't tell us how much are the two variables related, it just mentions +ve and -ve relation between 2 variables.
Correlation not only tells us the relationship between 2 variables(+ve / -ve), it also tells us the value of relationships between the two, which might help in determining whether we should keep the Variable or we can exclude them for modeling purposes.
I hope this was useful!
@@lokeshrathi5500 i have a little understanding in these concepts. my question is, if we are having a number, then it can have a sign (+ve or -ve) indicating the direction. we cannot have a sign without the magnitude.. this im still not clear.. correct me if im wrong..
Beautiful explanation
great explanation, thanks a lot.
Thanks Krish
Hi Krish,
Can you please implement covariance in python by taking a dataset.
In Python you can store any dataset in a pandas dataframe and use the .corr() method in order to see the Person's correlation between all the features. This method will display all the coefficients of every feature by comparing each individual with any other in the dataset.
@@Artificial_Intelligence_AI that .corr() method which you seggested makes the correlation matrix, she was asking how to make the co-variance matrix? I'm not sure, I think there is a .cov() method in numpy
Hi Krish,
Thanks for the explanation. I noticed the python cov method divides the variance by (n-1) instead of n, as u have given in the formula for covariance. Can you please tell me why do we consider n for a population covariance and (n-1) for a sample covariance?
Because we have sample data not the whole population
@@lakshmitejaswi7832 sample from population which is always less than populaion
what an easily understandable video!!! Thanks a lot>>>>>>
Thanks for the video, you explained well ! It helped me a lot.
This is amazing series 💯
Hey Krish, i did not find video on Pearson Correlation coefficient.thanks.
ruclips.net/video/6fUYt1alA1U/видео.html
@@NiharSanghvi Hi, Did you find Krish videos on Inferential Statistics or Hypothesis ?....plz respond
Hi, Thank you very much for this video. I really like your videos. I have a question:
Cov(A, B)= (1/n)* Sum[(A- avg A)*(B- Avg B)] ==> this is for population or sample ?? If It is sample then a) n =n-1 and b) while calculating the person coefficient the standard deviation formulae should also be n-1 or not? as my person coefficient value is going beyond -1 in a dataset which is not feasible. can you please clear this doubt.
Nice catch.I do have the same question.whether it is 1/n or 1/n-1?Please clarify Krish
For population it will be 1/n and for sample it will be 1/(1-n)
According to me and Krish sir's first video in this particular video, he is talking about "population Mean" reason-> he is denoting through "mu" in this particular video!
@@saketedgerd8729 Yes exactly
Hi Krish, we are looking for Pearson Correlation Coefficient video
Most easy explanation
No video on Pearson corr
Hi Krish. Thanks for the video. I request you to please sequence the videos per the content so that we can follow along the playlist
Awesome sir thank you
Thank you sir 🙂
we should memorise this equations of statistics? Is it required in ML?
Thanks. To the point. Hit the spot.
Please arrange this playlist in order sir 🙏
Very well explained...
Ok but it will give correct answer in linear case only right. when the data is non linear, it can not quantify, right?
Keep up with the great work!
Just Brilliant !!
Hi..thank you for explaining covariance. Just one question: +ve covariance means X is positively related to y and -ve covariance means X is negatively affecting y. But how can we say that X is NOT affecting y. In your example suppose someone trying to get covariance of floor number and park(just a vague example)
if x and y are independent of each other then the cov will be 0
NOTE: even if the relationship is increasing and then decreasing the cov will be 0 as they cancel out
can we have a zero covariance? if yes, then what would it mean?
A zero covariance means that these 2 variables are independent.
At mean
So what's difference between correlation and covariance?
Covariance indicates the direction of the linear relationship between variables. Correlation measures both the strength and direction of the linear relationship
nice video
make one video to find covariance with datasets
but variance have different formula right ..number of observations minus 1 ..
Show example with dataset
For covariance denominator must be n-1 rather than n
Nice
sir can you please make a video on how distribution is helpful in data science??????????? i know normal , gaussian distribution from your video but how these are helpful i dont know any real time scenario how should id use?
great
🙏
❤💫
wrong explanation: cov() not eqaul to var(), total destroyed the statistics
Can you explain further how it is not equal?
Epic
Thank you sir 🙂