Pearson Correlation Analysis on SPSS with Assumption Checks and Write Up (APA style)

HTML-код
- Опубликовано: 6 июл 2024
- Learn how to complete a Pearson correlation analysis on SPSS with assumption checks and how to report the results in APA style.
0:00 What is a Pearson correlation analysis?
0:52 Setting up the data file
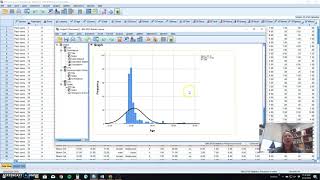
1:45 Checking the assumptions
6:18 Running the Pearson correlation analysis
6:36 Interpreting and reporting the results
Cohen’s (1988) criteria for r values: small = .10 to .29, medium = .30 to .49, large = .50 to 1.00. For example, if you have an r value of .35, you could say that there was a medium correlation.


thanks very much. Seriously it helped me with my thesis a lot...
Thanks Kavitha, glad it helped!
Thanks David, very informative and easy to grasp. I can now carryon with my work.
Thanks Elaine, glad it helped!
YOU ARE AMAZING!!!! Thank you very much. This is so helpful!!
Thanks Mashael, glad it helped!
Thankyou so much! This is really helpful!
Thanks Biruk, glad it helped!
Thank you!!!!
The best!!!! thank you for this clear explanation :))
Thanks Luisa, glad it helped!
Hi, thanks a lot, your presentation has really helped me present my results in my research assignment.
Thanks Joe, glad to hear it helped!
This presentation was very clear and informative. I enjoy watching your video. You make statistics very easy to understand. I would also want you to do one on Canonical correlation in SPSS. God bless you
Hi Carol, glad to hear the video was useful! I'll add canonical correlation to the list!
This is super helpful, thank you! I am doing a first year university correlational study on life satisfaction and mindfulness. When talking about the histograms (or any other graph where I want to discuss the graphs of the 2 variables), can I put multiple histograms (or graphs) in one appendix (e.g. Appendix A would include a histogram for life satisfaction and a histogram for mindfulness) or do they need to go into separate appendices APA? Thank you
Hi Darren, thanks for your question and glad the video helped! The APA Publication Manual doesn’t really give much guidance about this, though it does suggest that it’s OK to include multiple figures in a single appendix: “If multiple tables and/or figures (but no text) are combined into one appendix, label and title the appendix and also number and title the tables and/or figures within the appendix (e.g., Tables D1 and D2 are two tables in Appendix D).”
Thank you for this video, very useful. What do you do if two out of the three variables have a Shapiro-Wilk value that is statistically non significant indicating normality but the third has a significant value violating the normality assumption?
Hi Tayo,
Thanks for your question.
One option to consider would be running a Spearman correlation instead for the variable with non-normal data as this test doesn't assume normality. I have a video on this test too if you're interested: ruclips.net/video/pcSTjVFu-xI/видео.html&ab_channel=DavidRobinson%2CPhD
Hope that helps!
David.
very informative video, how would you do a multiple pearsons correlation? what would be the best way to check the assumptions?
Hi Moeez,
Thanks for your question.
Regarding running the analysis itself, the process is the same. For example, if wanted to explore the relationships between three variables instead of two, you would just transfer all three variables into the Variables box (in the window that opens when you go to Analyze, Correlate, Bivariate).
Regarding the assumptions, the process for checking normality would be the same. For example, if you wanted to check the normality of three variables instead of two, you could just transfer all three variables into the Dependent list box (in the window that opens when you go to Analyze, Descriptive Statistics, Explore). To check linearity and homoscedasticity, you would need to repeat the process of creating scatterplots X number of times. For instance, if you had three variables, you would need to create a scatterplot for variables 1 and 2, one for variables 1 and 3, and one of variables 2 and 3. However, if you had lots of variables this might be time-consuming, in which case you could create multiple scatterplots at once by going to Graphs, Legacy Dialogs, Scatter/Dot, then Matrix Scatter (instead of Simple Scatter).
Hope that helps!
David.
Hello. Thank you for this it was very helpful. I am currently looking at the relationship between body weight (in kg) and depression (measured via the BDI) (in overweight and obese participants). However, there is neither a positive nor negative relationship (everything is scattered). What text should I look at? The assumptions are violated.
Hi, thanks for your question. If the assumptions are violated, you could try run Spearman correlations instead.
Hi David!
Thanks for this video. I'm working on my dissertation.
What statistical test I should use if my dependent and independent variables are both continuous, but
I want to control for 2 nominal/ordinal confounding variables?
Thanks,
Risa
Hi Risa, thanks for your question. You could look into doing multiple regression as this would allow you to see whether the IV significant predicts the DV while controlling for the categorical variables. This video might be helpful: ruclips.net/video/aIqtdDTDClo/видео.html&ab_channel=MathGuyZero
@@DavidRobinsonPhD Thanks much David!!! I appreciate your response :-)
How do you copy and paste the correlation table from spss output to word and make it apa style on apple MacBook ? I copy and paste it to word and it does not allow me to create the table in apa format.
Why is it important to test the assumption of linearity and homoscedasticity?
it was a very useful video. If I have a lot of features, then how I can remove features which are less contributing to the accuracy or how to choose highly correlated features with the output using Pearson correlation
Hi Snehal, thanks for your question. I'm not quite sure what you mean by "features". Feel free to let me know more about what you're trying to do and I'll try to assist.
@@DavidRobinsonPhD hello, actualyy I have number of images and for each image I have HOG features. For each image 324 hog features. Now I want to remove the features which are redundant with respect to category of image. That is dimension reduction. So how to use Pearson correlation to reduce features using correlation which will give me good accuracy.
@@DavidRobinsonPhD also I want to ask whether the data vector( feature of one image) should have normal distribution while applying fir correlation.?? Because different images have different hog features and I have standardized them between 0 to 1 scale..can I apply Pearson on these features for finding mostly correlated feature with the image category..??
@@snehalgaikwad6436 Yes, the data should be approximately normally distributed, as this is an assumption of Pearson correlation. I haven’t used Pearson correlation for dimension reduction before, though perhaps you could look into principal components analysis, as discussed in this video: ruclips.net/video/qu4la8K212M/видео.html&ab_channel=how2stats