Flood Area Extraction using Sentinel-1A in Google Earth Engine: A Powerful Tool for Flood Mapping

HTML-код
- Опубликовано: 26 авг 2024
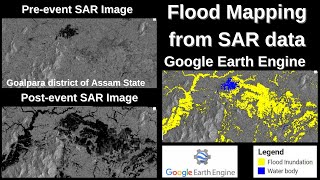
- In this video, we explore the powerful capabilities of Google Earth Engine in combination with Sentinel-1A satellite data for flood area extraction. By leveraging the synthetic aperture radar (SAR) imagery from Sentinel-1A, we demonstrate how to accurately identify and map flood-affected regions.
With step-by-step instructions and real-world examples, you'll learn how to harness the potential of Google Earth Engine's advanced geospatial analysis tools to detect and extract flood areas. From pre-processing SAR data to implementing classification algorithms, this tutorial provides valuable insights into the entire workflow.
🔥🔥For Pdf Notes and daily Remote Sensing and GIS Quizzes Follow me on Telegram🔥🔥🔥🔥
t.me/geomatics...
Follow me on:-
Instagram: geomatics_engg
Telegram Channel (For PDF Notes) : t.me/geomatics...
Playlists link that You should know about, If you are a Geomatics Engineer-
1. Gate Geomatics Engineering Part -1 Full Tutorial
• PART - A COMPLETE GATE...
2. Gate Geomatics Engineering Part - 2 Full Tutorial
• GATE GEOMATICS ENGINEE...
2. Gate Geomatics Engineering Part - 2 SURVEYING Full Tutorial
• PART - B SURVEYING GAT...
2. Gate Geomatics Engineering Part - 2 AERIAL PHOTOGRAMMETRY Full Tutorial
• PART -B AERIAL PHOTOGR...
3. ArcGIS tutorial for Beginner’s to Advance
• ARCGIS TUTORIAL FOR BE...
4. QGIS Tutorial for Beginner’s to Advance
• QGIS TUTORIAL FOR BEGI...
5. Google Earth Engine Tutorial
• GOOGLE EARTH ENGINE TU...
6. MCQ series of Geomatics Engineering
• MCQ SERIES GATE GEOMAT...
7. PYQ series of Geomatics Engineering
• PYQ GATE GEOMATICS ENG...
And If u guys a liking my videos , please subscribe my channel to get more new videos suggestion.
#Gategeomaticsengineering, #Gate, #geomaticsEngineering, #remote sensingandGIS, #arcgis, #qgis, #googleearthengine, #crashcourse, #gate,Flood area extraction
Flood mapping
Sentinel-1A satellite data
Google Earth Engine
Synthetic aperture radar (SAR)
Geospatial analysis
Flood detection
Remote sensing
Earth observation
Geospatial technology,Flood area extraction, Flood mapping, Sentinel-1A satellite data, Google Earth Engine, Synthetic aperture radar (SAR), Geospatial analysis, Flood detection, Remote sensing, Earth observation, Geospatial technology, Environmental monitoring, Natural disasters, Remote sensing applications, Earth observation data, Geospatial data analysis, Satellite imagery, SAR data processing, Flood management, Disaster response, Climate change impact, Geospatial technology tutorial, Google Earth Engine tutorial, Remote sensing techniques, Flood risk assessment, GIS analysis, Spatial data processing, Data visualization, Geospatial data management, Disaster preparedness, Flood emergency planning


![SAR Analysis in Earth Engine [GEE]](/img/1.gif)
After learning from these videos, familiarity with using GEE is improving, thanks a LOT
Wow! Easy to follow. Thank you for sharing
thank you very much. your video is easy to follow
Nice video keep it didi, best of luck for you, i will share this videos into several groups,
mam why you use minus 3 pls reply
it will be helpfull maam if you share how to download shapefile for indian districts
As usual, It was so smooth and easy, Thanks a lot mam. 🙏
What would you say the best way to test the accuracy of this flood map without having ground truth data. Comparing it to optical imagery?
Ma'am Please Make video on Crop Classification Map.
Very nicely done. Thank you
thank you very much, it's really helpful and easy to understand
Di, you are doing a fantastic job! Thank you
Thanks a lot 😊
Cool! Thanks for your video.
It gave me this error: flood: Layer error: Image.lt: If one image has no bands, the other must also have no bands. Got 0 and 1.
Hi I am running the same script but I keep getting an error saying There are no bands to visualize, what could be the problem?
Same here
thank you so much
VH should be used for floods?
You are amazing thankyou som much keep it up ma'am..🙏
Most welcome 😊
Thank you very much
How to validate the accuracy of the output maam? please reply
Great job. What is the rationale behind the values you have used like the difference of -3 used in the methodology section kindly explain why those values. Thanks
This value is based on trial and error...after after analyzing the flooded area pixel values
Great, thanks for your response. Does this mean there is a difference between the pixel values of flooded and non-flooded area and based on this -3 was selected probably as the mean value to represent flooded area, in the case of your study area.
I am asking because a change in the value of the difference can affect the area delineated as flood. How to know -3 is the right value in your case. How is the trial and error done?
Thank you very much. How can I access the GEE code for this tutorial?
How to convert SAR image to vector?? In GEE
Thank you so much. Would you please share the code?
Mam I am using the same code for the trial.......but when I run it , I found error like .....before.clip is not a function but in your video it runs without error ....please suggest the suitable changes
same question
Most probably there is something wrong when you created the var before = ..etc
In my particular case I was missing the () after mosaic, then it worked
👍 please make video on concept of coding in GEE because many times when we apply function in bataset and running then showing error "this is not function for dataset"
In earth engine most of the functions works on a single image...and not on an image collection ...that's why this error came up.
unable to pass through filterBounds('aoi');
Mam, I did the same for the whole of Bihar, however, when I am trying to export the final flood layer it is showing that the request payload size exceeds the limit,,, how to solve the issue mam.
hi bro mine is having problem can you pls help me
Good Morning,
Could you provide the code please?
Why difference (
This value is totally based on trial and error method, based on my AOI, it can be different for any other location.
Hello@@geomatics_engineering_sheelu, first of all thanks on your video tutorial, it was fantastic. But I wanna ask about the difference value. You said that the value is based on trial and error method on your AOI. How can I get the value to my AOI with that trial and error. What should I do, please help me. Thanks in advance
Thanks a lot for the tutorial. Would you please tell me how can I remove the the area which is outside the AOI and not considered in the analysis? Once I import this flooded area geoTIFF in QGIS, it shows the black area outside the ROI.
Thanks
You can simply reclassify it into 2 classes flooded and non flooded..and then from the reclassified layer extract the flooded layer in a sepearte tiff
You can reclassify it in 2 classes or if you have boundary than clip on it ..
hello dear can i have a quick reply when I export this data to drive and download its just black image nothing more what should I do.
Try to apply histogram stretching over the black image
I NEED A CODE FOR FLOOD MAPPING
If the flood is started at night dark. Can the image show of the flood?
Yes. Sentinal works on active sensing
Can we calculate how much the area affected by flood?
yes you can calculate, there are function available for these kind of calculation in GEE
Maam in ArcGIS it's showing black
In value both 1/1what should I do??
Try to apply histogram stretching over the Black tiff images.
how to do that
@@geomatics_engineering_sheelu
Did you solve this problem? would you like to share it please
Could you please provide the script?
Mam please provide shape file
Thank you so much. Would you please share the code?