Monte Carlo Technique: How to perform Business Simulations & Assess Projects Profitability | Excel

HTML-код
- Опубликовано: 22 авг 2024
- In this video we are going to address a complex form of simulation, a form that you might find very applicable in the real world. This one involves what goes into a very important feature of business, the bottom line.
Want to know what a Monte Carlo Simulation is? and how to use Monte Carlo Simulation technique for a profitable business ? In this video I have performed Monte Carlo Simulation in Excel.
What is a Monte Carlo Simulation?
Monte Carlo simulations are used to model the probability of different outcomes in a process that cannot easily be predicted due to the intervention of random variables. It is a technique used to understand the impact of risk and uncertainty in prediction and forecasting models.
Monte Carlo simulation can be used to tackle a range of problems in virtually every field such as finance, engineering, supply chain, and science.
Monte Carlo simulation is also referred to as multiple probability simulation.
Excel is a wonderfully flexible and powerful tool. For example, you can create models that let you modify your formula's inputs to estimate sales revenue and costs. You can also model systems that use random events such as product demand to estimate resource utilization and other costs.
Now before we get into today’s video where I will show you how to setup an excel model which can help you run an effective Monte Carlo Simulation to optimize your organizations supply chain and can help you with financial decision making.
Let’s discuss what a Monte Carlo Simulation actually is?
Monte Carlo simulation is a method of probability analysis done by running several variables through a model to determine the different outcomes
By using Monte Carlo simulations decision makers can determine the range of possibilities and their probability of occurrence. A Monte Carlo simulation works by constructing a mathematical model of the decision under consideration. Then the simulation is run, and different random variables are put into these models until there are enough outcomes to plot on a probability distribution curve. Based on the shape of curve created by the Monte Carlo simulation, decision makers will know where their ultimate decision falls within the various probabilities, they then make their decision based on the risk they are willing to take to get the outcome they want.
Now, let’s get to excel where I can show you how all of this actually works.
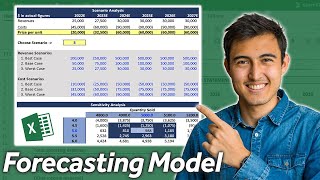
So, what you see on my screen is divided under three sections. Model Data, Probability of Item Demand & Simulation Data.
Creating an Excel simulation does involve a lot of steps, but once you get the hang of it, it's an extremely powerful tool that you'll be able to use over and over throughout your business and it's operations.
Monte Carlo Simulation in fiance is widely used for investment evaluation and can be used in several other industries and for different purposes.We're going to simulate a set of components that add up to produce a net income. We'll repeat the simulation 500 times, and we'll use an Excel tool called the data table to do it.
Monte Carlo Simulation is widely used in Finance and can be performed on various platforms like Monte Carlo Simulation in Matlab, Monte Carlo Simulation in R, Monte Carlo Simulation in Excel, Monte Carlo Simulation in Python, etc. Important thing to derive from this video is, performing Monte Carlo Simulation in Excel [Monte Carlo Simulation in excel data table is the key] can help you get probability distribution curve, which can tell you the probability of different outcomes of the scenario under consideration. This is widely used by profitable business to calculate the investment curve and profit and loss statement etc.
#MonteCarlo #Simulation #BusinessSimulation


Will be very helpful for showing operations management students how to set these up in Excel. Thank you for posting this video.
Thanks a lot for this video I had my Financial Modelling exam the next day and I was able to understand and execute this, I understood the concept thanks to your simple and effective explanation
Glad to know that this helped you
This small and lucid video is worth a big book on the subject. Thanks 🙏
Appreciate your comment @RavindraMulye
This is extremely helpful! Thank you for the great resource and sharing your knowledge! Gonna try it out tomorrow with out students in a sustainability university course to simulate some circular business models!
Hello, thanks for the vídeo. Very clear and objective explanation. Is it possible to hold these values and make them not to change ?
Very helpful vedio to explain Mante Carlo Analysis. Great job you've done.
Krishna, thank you so much for your comprehensive guide - this is perfectly explained, I appreciate you a lot!
Thanks!! I have few more Monte Carlo videos
@@krishnachiddarwar505 I'll be sure to check them:)
@@krishnachiddarwar505 one more thing - I realized there potentially should be added one final step, when calculating probability of net profit. We should eliminate outliers from simulated data to calculate probability more reliably.
I'd use countifs function to exclude any data points beyond +3 and -3 standard deviations from the mean. :)
Great Video, thanks. I'll be a loyal follower
Awesome, I used this to calculate profitability simulation for a business plan for a CEO position. Thanks!
Wow, hope you get that job!! And let’s be in touch. Lol 😂😂
Very clearly explained 😊
Excellent video.
Clear explanation, Thank you for this video!
You’re welcome!!
Nice job, man!
Thanks
sorry stupid question: how do you determine the standard deviation for the variable at the top
Thanks you so much, very helpful
Thanks
Great video. Could you explain the logic behind 'Data Table' function @ 3:37 onwards?
Thank you so much wish you the best
Glad you found it useful
Thanks for this video. I have learned very easy way to run this simulation on Excel. I used to handle too much cells with my weak Excel skill. I wonder if you could share the excel files you prepared as a template to utilize them for practices on.
Glad I could help you!
Let me see if I still have those excel files, share your email and I will send those over! 😊
@@krishnachiddarwar505 many thanks for your assistance. snndemirci@gmail.com is my e-mail. Happy new year :-)
Simple and helpul; thanks
Thanks
simple truth is that the mean is equal to net profit since std deviations does not have an impact as number of iteration increases
Ye
Thanks for showing an easier way to conduct MC simulation
Glad I could help
great video sir, very informative, i wonder if you could share a template of this spreadsheet to me? thankyou
Awesome video! Thank you!
Thanks
Thanks so so much...It is very helpful
Glad you liked it
Extremely helpful, thanks
I just want to know, why crystal ball doesn't support double definition of assumption?
Thank you sir, I am in urgent need of a M.C simulation video.
this was wonderful... thanks much
Appreciate your comment!
Good one!
thank you for share
Welcome!
the mean isnt resistant, so if the cost data is skewed, is the monte carlo simulation still viable or is there an alternative one?
How can you check if there is normal distribution?
You would see it in the histogram, if you are or aren’t getting the bell shape curve
Can this be used to determine impact and likelihood of operational risk?
Yes
What is difference between STD deviation sample & population
Thank you so much, found this so helpful in learning the technic itself,
Qtn, can we use the technic on other distribution other than the normal distribution? Two please explain the excel part differently from the technic part?
Answer to Question 1: yes we can analyze any type of curve. Answer to Question 2: I will try that in a different video
SIR COUNTIF FORMULA CELL & FIRST SIMULATION CAN"T BE SELECTED TOGETHER SO HOW O.OO % COME ?
Will get back to you
thank for explanation based on excel instead of minitab, would you please share the excel files? I 'll inform to you back comparing with minitab , best rgdds
You’re welcome
I have come across a research paper in which they have developed regression models using past data (uptil 2016). The pdfs of variables were already known from literature review. For 2017 onwards, they utilized the forecasted values as the mean of the distribution and took 10% of that mean as standard deviation for each year, and performed MCS to calculate annual uncertainty. Is there any relation or basis for taking 10% of mean as SD for future uncertainty analysis? I have analyzed the past data as well SD is nowhere near 10% of the mean value.
great video, but i was wondering how could we transfer this in crystal ball?
Hey, not sure if I understand your question correctly, could you elaborate?
Also how do you show the trend over a period of time like a monthly trend or annual trend using a chart
i think I got the answer for this, so ur simulations are considered based on monthly performance
What are the other distributions other than normal?
There are many, back loaded, front loaded, linear, uniform linear. It could be anything curve.
Thank you, nice! Interesting: I get 8,6% Profit while you get 86, something...
How do we interpret the results as the random values keep changing???
You focus on the mean values or the average values
is it possible to do monte carlo simulation , with only sales and fixed cost given for a business , calculating profitability for 60%-70% ?
Yes, it is
Thanks a lot for this nice explanation ...How can we determine the type of statistical distribution i.e uniform, normal, triangle ..etc
That needs another video, basically, we collect a large data sample speard over time and see the pattern (short version)
@@krishnachiddarwar505 We are waiting for this important video
2:32 WHY MY FORMULA IS NOT WORKING? IT IS SHOWING (NAME?)
👍👍👍
What is the input for 2nd simulation output?
Hi @Krishna Chiddarwar, is there a way to predict using Monte Carlo simulations, using the historic data from either fuel prices or exchange rate values?
You can definitely do that, the result will be dependent on two things. 1) Accuracy of your historical data. 2) Your input for the standard deviation.
@@krishnachiddarwar505 Much appreciated! In terms of the Standard Deviation, would it be a straight calculation using the sample selected into the Std Deviation formula?|
@@damianplanet5484 It would be same as I showed in this video. Sorry if I didn't answer it right, didn't get your question
my countif (outcome) formula doesn't work. Was there some pre-work to create what "Outcome" references?
Never mind :), I figured it out, created a range! Great video!!!
Thanks Julie!
Sir, can you please share this excel sheet to me.
How did you decide the standard deviation ?
As I said in the video, you would have to gather a large sample set and see the pattern for yourself, then select that in your projection
Hi any other dates available for this class?
Sorry, there’s no class. You can ask me any questions though. I’ll be glad to answer
This is a great video, thank you! Would you have any interest in helping me run a simulation on returns for a real estate investment?
Sure, let me know! Might not be able to help you right away. But will try
How i get this exel sheet
Share you contact details, I can see if I still have the excel file.
@@krishnachiddarwar505 Hi can you share it to me too? Thanks!
Great video.