Great video. You may directly create a multivariate distribution. And it’s always better to use e.g. a Student t Distribution with EWMA in order to estimate the covariance matrix. Otherwise you’re model is going to produce too many overshoots
Definitely only a simplified model - assuming returns are normally distributed. However a good back-test is to always be checking covariance parameters are aligned to current market conditions
Nice video with clear sound and good visuals. I'm not sure it's for you, but how would you feel about improving the algorithm by moving the Cholesky calculation out of the loop? It only needs to be calculated once, right?
really good video. question: could you calculate the historical variance of the portfolio and use that instead of the L matrix? something like portfolio_returns_t = portfolio_std*Z_t
I am trying to create a retirement calculator for myself and one thing I would like to do is compare Roth Vs Traditional but for example with Roth IRA vs Trad IRA, you can't compare 6500 Roth vs 6500 Trad, you have to compare 6500 Roth vs 6500 Trad + Investing the difference into a brokerage ($6500 Roth vs $6500 Trad + $X in brokerage). I can kind of figuring out what X is by calculating take home with 6500 Trad and subtracting what the take home is for 6500 Roth, the problem is that most index funds have a dividend component. That doesn't matter in an IRA but that $X that would be in a brokerage would have you paying taxes on those dividends which would mess up the calculations. I would need to figure out what the taxes are on those dividends to make it so that the usable income is identical in both examples that I am comparing. I can figure out the taxes for LTCG on qualified dividends but I am not sure how to calculate how much of a dividend you get over time. Do you know of any good videos or articles on anything related to calculating dividends in python?
Thanks for the GREAT video! One question if I may: at 11:42, would you please elaborate, or if you have another link, for this return formula + Cholesky application? Thanks a lot!
I am running your code in Jupiter Notebook. However, when I am running this line "meanReturns, covMatrix = get_data(stocks[0], startDate, endDate)", it gives me an error saying "TypeError: string indices must be integers." Can you suggest me how to solve this problem?
import pandas as pd import numpy as np import matplotlib.pyplot as plt import datetime as dt from pandas_datareader import data as pdr import yfinance as yf yf.pdr_override() use this code
@@MicheleCedolin import pandas as pd import numpy as np import matplotlib.pyplot as plt import datetime as dt from pandas_datareader import data as pdr import yfinance as yf yf.pdr_override() use this
Nice video! Two quick questions tho: 1) the length of the cov matrix is len(weights) x len(weights), right? so why the inner product (L,Z) works? should it not be inner(Z,L) since Z is (T,len(weights)? And therefore meanM can be (T, len(weights)) and not the transpose of that... 2) Why is it necessary to sum the mean in the calculation of the daily returns? Couldn't I just use the inner product?
the second question I just checked is to make the new synthetic time series have the same mean as the original. If I don't do this I get a matrix with the same covariance but not the same mean. Do we want them to have the same mean as well?
Yes, we’ve made a significant assumption about volatility. The covariance matrix is where this comes in. By computing the historical covariance matrix using past stock data, we are assuming that the stock returns will follow these correlations and volatility with respect to each other, into the future.
hi thanks for impressive video. I am majoring in finance and i cant come up with research topic regarding portfolio optimization. can you help me with this issue? any recommendation from you can be really instructive
Great explanation for Monte Carlo simulation. I was trying it out for a single stock but on my code it is showing : ModuleNotFoundError: No module named 'pandas_datareader' How can i rectify this? I downloaded pandas, numpy and matplotlib on the terminal but it's still not working.
Hi PyQuant! May I know is it possible to simulate stock prices using the same technique? In this video you assume the returns follows multivariate normal distribution and then do the Monte Carlo simulation for returns. I am wondering if I can do the same thing for stock prices by assuming certain distribution such as GBM?
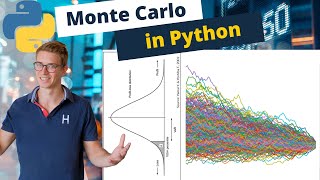
Cool video and walk-through. However, how do I make sense of the cool line chart with all simulation paths? The portfolio values in 100 days can be 4000 or 19000 for example. What is the chart telling me in terms of insights? Or would a histogram be more appropriate where we can at least see the buckets and frequency?
Great video! With the function to create random weights for the portfolio, is there a way to alter it to make minimum weights? Also, what if I want to run a Monte Carlo on a portfolio where I already know the weights and don't want to generate random weights?
Please note that I’m not optimising the weights of this portfolio. I’m just assigning random weights once. You can replace that line with you individual weights in a list / numpy array.👍
If you want to specify your weights, you could make an array that has the same length as the number of stocks but just manually enter the weights. Just make sure the weights add up to 1. IE: weights=[.2, .2, .2, .1, .1, .2]
Hi QuanPy, thanks for the great video! One question do you have any detailed explain or recommended material for the portfolio return at the t, the formula you show up on the right upper corner from 11:35? I know single stock Brownian Motion, but I am not following why portfolio return is in that form and why use timeseries mean return as level. Also should it depend on t as well as BM? Many Thanks!
Just to tell you that I could not see the code written on the screen because it is black and very small. I wish you had made it bigger, and you had made your picture not big. I was looking forward to learning from you.
This video isn't about portfolio optimisation, but to answer your question you should look at maximising some kind of utility function with certain constraints. Famous optimisation solution to this is obviously Modern Portfolio Theory - check out my video on that for more
I have a doubt. Once you compute daily returns your portfolio weights change. Your code assume weights are constant and that doesn’t sound right to me. In other words, if a stock daily returns on any given day jump about 10% (extreme example) then its weight at the end of that day will be greater than the one at the beginning of the day. Thoughts?
The weights are the weights of each stock in your portfolio, for example if you have 100 dollars total, 2 stocks, and the weights on those stocks are 0.5 and 0.5 you will have 50 dollars allocated to each stock.
This is amazing. I have a question: do you need to connect to Bloomberg (or any other terminal) for this code to run? I am getting the following error message : print(meanReturns) Traceback (most recent call last): File "", line 1, in print(meanReturns) NameError: name 'meanReturns' is not defined
Definitely not 👍 I can see here you are trying to print meanReturns (in line 1) without having defined it? Make sure you call the getData function and declare meanReturns variable.
@@QuantPy Thanks a lot. I am a bit stocked again. def get_data(stocks, start, end): stockData=pdr.get_data_yahoo(stocks, start, end) StockData=StockData['Close'] returns=stockData.pct_change() meanReturns=returns.mean() covMatrix=returns.cov() return meanReturns, covMatrix stockList=['CBA', 'BHP','TLS','NAB','WBC','STO'] stocks=[stock + '.AX'for stock in stockList] endDate=dt.datetime.now() startDate=endDate-dt.timedelta(days=300) meanReturns,covMatrix = get_data(stocks,startDate,endDate) print(meanReturns) Traceback (most recent call last): File "", line 14, in meanReturns,covMatrix = get_data(stocks,startDate,endDate) File "", line 3, in get_data StockData=StockData['Close'] UnboundLocalError: local variable 'StockData' referenced before assignment It is now saying "local variable 'StockData' referenced before assignment " - not sure what I am getting wrong
You’ve typed stockData=stockData[‘Close’] incorrectly, you placed a capital letter on StockData. Python variables are case sensitive. My advice, read the error message and work through the code line by line next time 👍 good luck
Hi there thanks for the video. If I want to change the Stock list e.g. TSM (available on yahooFinance) I get the following error: RemoteDataError: No data fetched using 'YahooDailyReader' . Any solutions or ideas there?
Is there a way to adapt the monte carlo simulation when there is a dynamic allocation of the portfolio. In much simpler words: I change the stocks in the portfolio with a weekly frequence following certain algorithms (technical, etc.) Is it possible to construct a code that can read the stocks in portfolio and calculate the max potential loss every week? Thanks for attention
Yes this is possible, honestly if you can define what you’d like to do, you can almost certainly implement a solution. Feel free to adjust the code as needed. Good luck
Hi! I'm having the following error: Traceback (most recent call last): File "D:/Programming/PycharmProjects/Modelos Computacionales 2021/Clase 8/Método de Monte carlo.py", line 24, in meanReturns, covMatrix = get_data(stocks, startDate, endDate) File "D:/Programming/PycharmProjects/Modelos Computacionales 2021/Clase 8/Método de Monte carlo.py", line 11, in get_data stockData = pdr.get_data_yahoo(stocks, start, end) File "C:\Users\marce\AppData\Local\Packages\PythonSoftwareFoundation.Python.3.8_qbz5n2kfra8p0\LocalCache\local-packages\Python38\site-packages\pandas_datareader\data.py", line 80, in get_data_yahoo return YahooDailyReader(*args, **kwargs).read() File "C:\Users\marce\AppData\Local\Packages\PythonSoftwareFoundation.Python.3.8_qbz5n2kfra8p0\LocalCache\local-packages\Python38\site-packages\pandas_datareader\base.py", line 258, in read df = self._dl_mult_symbols(self.symbols) File "C:\Users\marce\AppData\Local\Packages\PythonSoftwareFoundation.Python.3.8_qbz5n2kfra8p0\LocalCache\local-packages\Python38\site-packages\pandas_datareader\base.py", line 268, in _dl_mult_symbols stocks[sym] = self._read_one_data(self.url, self._get_params(sym)) File "C:\Users\marce\AppData\Local\Packages\PythonSoftwareFoundation.Python.3.8_qbz5n2kfra8p0\LocalCache\local-packages\Python38\site-packages\pandas_datareader\yahoo\daily.py", line 153, in _read_one_data data = j["context"]["dispatcher"]["stores"]["HistoricalPriceStore"] TypeError: string indices must be integers And i'm not sure how to fix it
Hi mate not sure if you figured it out but I put a comment above with the solution, you need to use YFinance instead of Pandas Data Reader Replace line 8 of his code with: import yfinance as yf Replace line 12 with: stockData = yf.download(stocks, start, end)
What's the point of complicating matters by throwing in abstractions/ indirections such as covariance matrix and cholesky decomposition, when we can just simulate portfolio returns by calculating cumprod of weighted stock returns directly?


Best video on the internet on financial monte carlo simulation with python
Great video. You may directly create a multivariate distribution. And it’s always better to use e.g. a Student t Distribution with EWMA in order to estimate the covariance matrix. Otherwise you’re model is going to produce too many overshoots
Great video! It'd be interesting to see how you'd translate this into a back-testable strategy as well
Definitely only a simplified model - assuming returns are normally distributed. However a good back-test is to always be checking covariance parameters are aligned to current market conditions
@@QuantPy Yeah, a backtesting video, if possible, would be assume. Thanks for your great work anyway (-:
dePrado Deflated Sharpe Ratio and other Sharpe Ratio concepts.
Thank you for your excellent tutorials. Merry Christmas and Happy New Year!
Nice video with clear sound and good visuals. I'm not sure it's for you, but how would you feel about improving the algorithm by moving the Cholesky calculation out of the loop? It only needs to be calculated once, right?
Great suggestion. Yes the lower triangular matrix for the cholesky composition can be moved above and out of the loop.
When inserting a matrix/vector of zeroes you can use np.zeros()
Great video ! Thank you for your efforts, really helpful
nicely done, straight to the point
Great video thank you so much for sharing with us..........
Could you please create a video on stress testing also while using MC + (VaR, ES)
really good video. question: could you calculate the historical variance of the portfolio and use that instead of the L matrix? something like portfolio_returns_t = portfolio_std*Z_t
Great Video ! These are really really helpful
@0:07 It's the top left, not top right screen. Well, my monitor at least.
I am trying to create a retirement calculator for myself and one thing I would like to do is compare Roth Vs Traditional but for example with Roth IRA vs Trad IRA, you can't compare 6500 Roth vs 6500 Trad, you have to compare 6500 Roth vs 6500 Trad + Investing the difference into a brokerage ($6500 Roth vs $6500 Trad + $X in brokerage). I can kind of figuring out what X is by calculating take home with 6500 Trad and subtracting what the take home is for 6500 Roth, the problem is that most index funds have a dividend component. That doesn't matter in an IRA but that $X that would be in a brokerage would have you paying taxes on those dividends which would mess up the calculations. I would need to figure out what the taxes are on those dividends to make it so that the usable income is identical in both examples that I am comparing. I can figure out the taxes for LTCG on qualified dividends but I am not sure how to calculate how much of a dividend you get over time.
Do you know of any good videos or articles on anything related to calculating dividends in python?
Amazing work! Thank you for sharing!
Direct and quick!!! Excellent!
Very useful video, are we assuming the randomness follows a geometric brownian motion ?
portfolio_sims meaning portfolio of simulations? Tip: Use the typing module to explain types and use descriptive variables to make sense
very neat, thank you for the video !
Keep on the good stuff mate :)
This is seriously impressive & makes a lovely graph but can you explain how to use the output in practice?
This stuff gives you an understanding, what can be with your portfolio, based on daily stocks returns
Thanks for the GREAT video! One question if I may: at 11:42, would you please elaborate, or if you have another link, for this return formula + Cholesky application? Thanks a lot!
Great stuff! thanks for sharing!
Very interesting and useful work. Very good. Please where can I find the text of the code? Thank you, Edoardo
Great video!
but cov matrix is not always invertible (if matrix is not positively defined), so cholesky decomposition does not always work
I am running your code in Jupiter Notebook. However, when I am running this line "meanReturns, covMatrix = get_data(stocks[0], startDate, endDate)", it gives me an error saying "TypeError: string indices must be integers." Can you suggest me how to solve this problem?
i have the same problem... can you solve??
Did you solve it ?
getting the same error, can someone help me out?
import pandas as pd
import numpy as np
import matplotlib.pyplot as plt
import datetime as dt
from pandas_datareader import data as pdr
import yfinance as yf
yf.pdr_override()
use this code
@@MicheleCedolin import pandas as pd
import numpy as np
import matplotlib.pyplot as plt
import datetime as dt
from pandas_datareader import data as pdr
import yfinance as yf
yf.pdr_override()
use this
Why assuming normal distribution? No black swans, fat tails?
Thank you ,
Thank you for the video! How did you do the animation of mc in the beginning of the video? Sorry, if it is an easy question, I'm newbie in programming
the most important thing is action, like what can you actually do with that?
Nice video! Two quick questions tho:
1) the length of the cov matrix is len(weights) x len(weights), right? so why the inner product (L,Z) works? should it not be inner(Z,L) since Z is (T,len(weights)? And therefore meanM can be (T, len(weights)) and not the transpose of that...
2) Why is it necessary to sum the mean in the calculation of the daily returns? Couldn't I just use the inner product?
the second question I just checked is to make the new synthetic time series have the same mean as the original. If I don't do this I get a matrix with the same covariance but not the same mean. Do we want them to have the same mean as well?
turn the background music down please next time, very distracting
Thanks for the video, but the "get_data" function in line 24 isn't working for me for some reason.
great video! but the background music makes it very hard to focus!
Great attempt! In your video you don't mention anything about volatility. Have you made any specific assumptions on this matter?
Yes, we’ve made a significant assumption about volatility. The covariance matrix is where this comes in.
By computing the historical covariance matrix using past stock data, we are assuming that the stock returns will follow these correlations and volatility with respect to each other, into the future.
@@QuantPy Big Thumbs Up!!You helped me understand MC simulation completely!! Keep up the exceptional work!
Could you kindly explain if this process consider rebalancing the portfolio?
hi thanks for impressive video. I am majoring in finance and i cant come up with research topic regarding portfolio optimization. can you help me with this issue? any recommendation from you can be really instructive
If I wanted this in a fan chart showing confidence intervals what would I do.
What number is typically used as pseudo-random numerical generator in portfolio theory of Monte Carlo?
Great explanation for Monte Carlo simulation.
I was trying it out for a single stock but on my code it is showing :
ModuleNotFoundError: No module named 'pandas_datareader'
How can i rectify this?
I downloaded pandas, numpy and matplotlib on the terminal but it's still not working.
pip install pandas_datareader
Great video! Is there a quick adjustment for me to replicate this code but only for a single security with a specified estimate on volatility?
Could you explain what changes would be need to be made if my time series is monthly instead of daily?
What is the maximum no of simulations which we can run and does it depend on computing power?
thanks!
Hi PyQuant! May I know is it possible to simulate stock prices using the same technique? In this video you assume the returns follows multivariate normal distribution and then do the Monte Carlo simulation for returns. I am wondering if I can do the same thing for stock prices by assuming certain distribution such as GBM?
Cool video and walk-through. However, how do I make sense of the cool line chart with all simulation paths? The portfolio values in 100 days can be 4000 or 19000 for example. What is the chart telling me in terms of insights? Or would a histogram be more appropriate where we can at least see the buckets and frequency?
Histogram would be more appropriate
How is the Monte carlo method different to the ARIMA and LSTM models?
Great video! With the function to create random weights for the portfolio, is there a way to alter it to make minimum weights? Also, what if I want to run a Monte Carlo on a portfolio where I already know the weights and don't want to generate random weights?
Please note that I’m not optimising the weights of this portfolio.
I’m just assigning random weights once. You can replace that line with you individual weights in a list / numpy array.👍
If you want to specify your weights, you could make an array that has the same length as the number of stocks but just manually enter the weights. Just make sure the weights add up to 1. IE: weights=[.2, .2, .2, .1, .1, .2]
Hi QuanPy, thanks for the great video! One question do you have any detailed explain or recommended material for the portfolio return at the t, the formula you show up on the right upper corner from 11:35? I know single stock Brownian Motion, but I am not following why portfolio return is in that form and why use timeseries mean return as level. Also should it depend on t as well as BM? Many Thanks!
Hey man, there is an article on medium that ripped off your code 1:1.
Just to tell you that I could not see the code written on the screen because it is black and very small. I wish you had made it bigger, and you had made your picture not big. I was looking forward to learning from you.
(Might help some of you)
Ran into an issue with pandas_datareader when importing on VS code. It was because of the interpreter used on VS code.
hello mate, why is it the timedelta(days=300)? where does the 300 come from ? thanks
You are awesome
What would be the strategy if we would want to optimize the weights in order to find the best Portfolio weights?
This video isn't about portfolio optimisation, but to answer your question you should look at maximising some kind of utility function with certain constraints. Famous optimisation solution to this is obviously Modern Portfolio Theory - check out my video on that for more
How about a portfolio with equity and cds and bonds
Hello, thanks for the video, very helpful. What Python environment are you using here?
I’m using anaconda’s conda for python environment, the IDE is Visual Studio Code.
@@QuantPy thank you!
I have a doubt. Once you compute daily returns your portfolio weights change. Your code assume weights are constant and that doesn’t sound right to me. In other words, if a stock daily returns on any given day jump about 10% (extreme example) then its weight at the end of that day will be greater than the one at the beginning of the day. Thoughts?
The weights are the weights of each stock in your portfolio, for example if you have 100 dollars total, 2 stocks, and the weights on those stocks are 0.5 and 0.5 you will have 50 dollars allocated to each stock.
great video. Will you produce var calculation with mcs in python?
Will be the next video
This is amazing. I have a question: do you need to connect to Bloomberg (or any other terminal) for this code to run?
I am getting the following error message :
print(meanReturns)
Traceback (most recent call last):
File "", line 1, in
print(meanReturns)
NameError: name 'meanReturns' is not defined
Definitely not 👍
I can see here you are trying to print meanReturns (in line 1) without having defined it?
Make sure you call the getData function and declare meanReturns variable.
@@QuantPy Thanks a lot. I am a bit stocked again.
def get_data(stocks, start, end):
stockData=pdr.get_data_yahoo(stocks, start, end)
StockData=StockData['Close']
returns=stockData.pct_change()
meanReturns=returns.mean()
covMatrix=returns.cov()
return meanReturns, covMatrix
stockList=['CBA', 'BHP','TLS','NAB','WBC','STO']
stocks=[stock + '.AX'for stock in stockList]
endDate=dt.datetime.now()
startDate=endDate-dt.timedelta(days=300)
meanReturns,covMatrix = get_data(stocks,startDate,endDate)
print(meanReturns)
Traceback (most recent call last):
File "", line 14, in
meanReturns,covMatrix = get_data(stocks,startDate,endDate)
File "", line 3, in get_data
StockData=StockData['Close']
UnboundLocalError: local variable 'StockData' referenced before assignment
It is now saying "local variable 'StockData' referenced before assignment
" - not sure what I am getting wrong
You’ve typed stockData=stockData[‘Close’] incorrectly, you placed a capital letter on StockData. Python variables are case sensitive. My advice, read the error message and work through the code line by line next time 👍 good luck
@@QuantPy Wow, I just couldn't see that. The could has worked now!! Thanks! It is such a tremendous work you are doing. God bless
How do you memorize all your code?
Nice! but te music is too loud.
Hi there thanks for the video. If I want to change the Stock list e.g. TSM (available on yahooFinance) I get the following error: RemoteDataError: No data fetched using 'YahooDailyReader' . Any solutions or ideas there?
Think I may have mentioned in the video, you’ll need to remove “.AX” from the stock name. Just send “TSM” through 👍
Is there a way to adapt the monte carlo simulation when there is a dynamic allocation of the portfolio. In much simpler words: I change the stocks in the portfolio with a weekly frequence following certain algorithms (technical, etc.) Is it possible to construct a code that can read the stocks in portfolio and calculate the max potential loss every week? Thanks for attention
Yes this is possible, honestly if you can define what you’d like to do, you can almost certainly implement a solution.
Feel free to adjust the code as needed. Good luck
Great work man! but please remove that background sound
what re the titles of the books on the table?
statistical parroting?
why I can't add my own stocks?
Un semblant de probabilité par trame
Hi! I'm having the following error:
Traceback (most recent call last):
File "D:/Programming/PycharmProjects/Modelos Computacionales 2021/Clase 8/Método de Monte carlo.py", line 24, in
meanReturns, covMatrix = get_data(stocks, startDate, endDate)
File "D:/Programming/PycharmProjects/Modelos Computacionales 2021/Clase 8/Método de Monte carlo.py", line 11, in get_data
stockData = pdr.get_data_yahoo(stocks, start, end)
File "C:\Users\marce\AppData\Local\Packages\PythonSoftwareFoundation.Python.3.8_qbz5n2kfra8p0\LocalCache\local-packages\Python38\site-packages\pandas_datareader\data.py", line 80, in get_data_yahoo
return YahooDailyReader(*args, **kwargs).read()
File "C:\Users\marce\AppData\Local\Packages\PythonSoftwareFoundation.Python.3.8_qbz5n2kfra8p0\LocalCache\local-packages\Python38\site-packages\pandas_datareader\base.py", line 258, in read
df = self._dl_mult_symbols(self.symbols)
File "C:\Users\marce\AppData\Local\Packages\PythonSoftwareFoundation.Python.3.8_qbz5n2kfra8p0\LocalCache\local-packages\Python38\site-packages\pandas_datareader\base.py", line 268, in _dl_mult_symbols
stocks[sym] = self._read_one_data(self.url, self._get_params(sym))
File "C:\Users\marce\AppData\Local\Packages\PythonSoftwareFoundation.Python.3.8_qbz5n2kfra8p0\LocalCache\local-packages\Python38\site-packages\pandas_datareader\yahoo\daily.py", line 153, in _read_one_data
data = j["context"]["dispatcher"]["stores"]["HistoricalPriceStore"]
TypeError: string indices must be integers
And i'm not sure how to fix it
Hi mate not sure if you figured it out but I put a comment above with the solution, you need to use YFinance instead of Pandas Data Reader
Replace line 8 of his code with: import yfinance as yf
Replace line 12 with: stockData = yf.download(stocks, start, end)
This worked for me too
well i tried the code but by loading the data from yahoo there comes the error no data fetched from yahoo finance does anybody know how to fix that?
same here! someone pls help!
i like your video but please lower the music ^^
'NoneType' object has no attribute 'group' getting this error
same, have you found a way to fix it?
What is the significance of covariance matrix here?
What's the point of complicating matters by throwing in abstractions/ indirections such as covariance matrix and cholesky decomposition, when we can just simulate portfolio returns by calculating cumprod of weighted stock returns directly?
Background music that last for two minutes is very noisy
Dude your music is too loud
I'd love this without the annoying background music at the start that is sometimes more audible than your voice!
brother, turn the annoying music off
What is with the stupid background music?
I have a question. I am confused why you do +1 and np.cumprod? shouldn't np.inner(weights, dailyReturns.T) be the portfolio daily return?
Great video!