Alberto, your videos are not only super helpful for understanding Power BI and DAX, but I absolutely love your Italian accent when you speak in English! It makes the learning experience even more enjoyable. Grazie for sharing your knowledge with such clarity and charm!
The company I work for is currently switching from Tableau to Power BI. So, I'm coming from 5 years of Tableau experience and having a hard time with Power BI right now. Thank you for your videos thy help me with the transition!
Just found this video and what an eye opener for beginners like me. I always try to create new measure than add a calculated column. This is indeed helpful! Thank you!
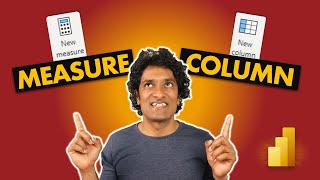
In Power BI, *calculated columns* work row-by-row in the table (using **row context**), so they calculate values for each row and store them. On the other hand, *measures* are dynamic and depend on filters and slicers applied in the report (using *filter context* ). For example, in the formula `SUMX(Sales, Sales[Quantity] * Sales[Net Price])`, `SUMX` creates a row context for the measure, iterating over each row in the *Sales* table, calculating the sales amount, and then summing it up. On a different topic *CALCULATE* changes the *filter context* of a measure or expression. It's useful when you want to modify filters or apply conditional logic, like calculating sales only for a specific region or time period. Use it to *change filters* and control the calculation’s context.
**measures* and *calculated columns* behave differently in Power BI, and understanding the **row context** and **filter context** is key to knowing when to use each. *1. Calculated Columns:* - A *calculated column* is like adding an extra column in your dataset. It is calculated **row by row** in your table and the result is stored in your data model. This means it has **row context**, which means it can perform calculations at the individual row level.
- Example: Line Amount Column = Sales[Quantity] * Sales[Net Price]
This creates a new column where, for each row in the *Sales* table, the value of *Quantity* is multiplied by **Net Price**. Every row has its own calculation based on the row context. - *Use Case*: Calculated columns are ideal for calculations you want to perform **at the row level** and store as part of your data model. For example, if you need to filter or slice by the calculated value, it should be a column. --- ### **2. Measures:** - A **measure** is a formula used to aggregate or calculate data on the fly. Measures don't store results directly in the data model; they calculate results dynamically when used in a visual (like a chart, table, or matrix). Measures depend on the **filter context**, meaning they calculate based on the filters or slicers applied at a given time. - Example: ```DAX Sales Amount Measure = SUMX(Sales, Sales[Quantity] * Sales[Net Price]) ``` Here, the `SUMX` function iterates over the **Sales** table (row by row) to calculate the total sales amount. In this case, it is creating a "virtual column" for each row in the **Sales** table where it multiplies **Quantity** by **Net Price** and then sums those values based on the current filter context (such as region, product, or time period). - **Use Case**: Measures are used for calculations that are **dynamic** and **aggregate data**. If you want the result of the calculation to change based on the filters applied in your report (like summing sales for a specific time period or region), a measure is more appropriate. --- ### **Row Context vs Filter Context**: - **Row Context** (associated with **calculated columns**): In row context, calculations happen **for each individual row** in the table. For example, when you define a calculated column, it iterates through each row of the table to produce the result.
- **Filter Context** (associated with **measures**): Measures operate with **filter context**, which means they are calculated **based on filters** applied to the data model (e.g., slicers, filters on visuals, or columns). This allows measures to aggregate data dynamically. ### **SUMX and Row Context**: Yes, you are correct that `SUMX` is a **row context function**. It iterates over the table (in this case, the **Sales** table), and for each row, it calculates the expression (Sales[Quantity] * Sales[Net Price]), giving each row its own context. The final result is the **sum** of all those row-by-row calculations, combining the row context into a **measure** that respects the filter context of the report. --- ### **Key Differences**: - **Calculated Columns** are static and row-dependent (i.e., they have row context), and the values are stored in the table. - **Measures** are dynamic, dependent on the filters and context of the report (i.e., they have filter context), and are computed on the fly. **Conclusion**: - Use **calculated columns** when you need to calculate values row by row and want to store the result for future use. - Use **measures** when you need dynamic calculations that depend on the report’s filters or user selections.
4 points summary 1. If you want to slice and dice by a column, use a calculated column 2. If you want to use a filter context, use a calculated column 3. If you want to consume less data for storage, use a measure 4. Prefer measures over a calculated column wherever possible
A measure is evaluated in the context of the cell evaluated in a report or in a DAX query, whereas a calculated column is computed at the row level within the table it belongs to
Calculated columns are computed during the database processing and then stored in the model. Measures are not stored in the model as they are computed at query time and do not use memory
Ciao friends --> got the like! also who couldn't possibly like wonderfully useful content form a person with the last name of Ferrari! amazing video, thank you
Thank you for the explanation. Can you use a measure to create a calculated column? I am trying to get a date value from slicer, and storing the value in a measure. I want to use that date value to create a new column. But I get the same value for all the rows.
You're right, you should use calculated columns when Power Query would be too expensive - for example computing the value based on the content of other tables could be very slow in Power Query.
When you install the latest version of these tools (DAX Studio, Tabular Editor, Analyze in Excel for Power BI Desktop, ALM Toolkit) that tab appears automatically. Tool links available at www.sqlbi.com/tools/
Could I ask another question, I've just bought your book The Definitive Guide to Dax (2nd Ed) and I'm reading about leveraging the performance between calculated columns and Measures, If you separate your Dataset from your visual model, would that not improve performance if you used Calculated columns vers Measures on your visuals?
From a performance point of view, it's better to keep calculated columns on the same model, not on a remote model. However, oftentimes calculated columns are not required for performance and they just increase model size and slow down refresh. Do your own evaluation!
i have a customer contract table with start and end date. and i want to sum the sales from the sales fact table ( bêtween the start -end date) for each contract, do you have any suggestion , tried many articles but still not yet have soltuoons
@@SQLBI but the example given is only 1 fact table so might be easier to do , here I have a 2 table separately : sales orders table , and the other is the "contract table" ( which is like a campaign with start and end date , wanna see the sales during each campaign )
It really depends on many details about the report you want to produce. If there are no multiple active campaign for the same date, you should apply the active campaign to the transaction, if there could be multiple campaigns active for a single transaction you should keep the calculation at runtime. There are several discussions about similar problems in our book, even though not exactly the one you asked for: www.sqlbi.com/books/analyzing-data-with-microsoft-power-bi-and-power-pivot-for-excel/
I'm going to buy this book and learn more, don't know if it helps since the problem not quite the same as you said. Between this book and the defenitive guide to Dax ? which would u recommedn more?
The Definitive Guide to DAX is about the DAX language. Analyzing Data with Microsoft Power BI and Power Pivot for Excel is about data modeling. They cover different topics, you need knowledge on both areas. If you already know dimensional modeling (Kimball's methodology) then you only need DAX, but the question you raised is a typical data modeling question!
Thanks for the content, and just for clarification, would like to know this.. The line amount calculated column had same values in the table where as it was still getting huge different incorrect values under the filter context when used in the visual.. I Believe that this is because of the number of rows that gets evaluated in the filter context giving different wrong results, otherwise if rows are equally distributed then we would see same wrong result in the visual.. can you please confirm.
@@Bharath_PBI You're seeing different values in the visual because it's being filtered by brand. In each row, it's aggregating the grand total by the total number of rows that contain each brand. So for example, if the number 10 is repeated in the calculated column, and a product of brand X appears 9 times and a product of brand y appears 10 times and there are actually 1000 rows, in this example, brand X will show 90 (9 * 10) and brand y, 100 (10 * 10) whereas the grand total of all brands will be 10,000 (1000 rows with 10 repeated) I hope this explanation helps. I'm only a year and a half into this so I'm open to correction.
Hi Alberto - my two cents: A measure is a closed unit of aggregation that returns a scalar result. The input of a measure is the current evaluation context. No row context exists prior to executing a measure. A calculated column is the result of a DAX expression. The input of a calculated column is a single row row-context. No filter context exists prior to executing the calculated column. No number of CALCULATEs can make a DAX expression into a measure. Only the DAX engine can do that. It ‘s a closed deal so to speak.
@@SQLBI What I mean is that there is a notion circulating that if you embed a DAX expression in two CALCULATEs that is the equivalent of a measure. CALCULATE(CALCULATE(expression, filter_1, … filter_n)) The justification for this would be that no row contexts are visible to neither the expression nor the filter arguments. If this was correct you should be able to reference a variable declared outside a measure from within a measure. So if you have a calculated column with this DAX expression: VAR aVariable = something RETURN CALCULATE(CALCULATE(expression * aVariable , filter_1, … filter_n)) and you actually could save CALCULATE(CALCULATE(expression * aVariable , filter_1, … filter_n)) as a measure you should be able to do this: VAR aVariable = something RETURN [expressionAsAMeasure] Obviously you can't. A DAX expression becomes a measure when you save the expression as a measure from a client tool that adds the appropriate Meta data AND the DAX expression is isolated from the outside world except for the current evaluation context. Measure = { measure metadata + evaluation context + DAX expression } So a measure is a closed deal (a Closure?). I probably shouldn't have written the last paragraph in my original comment :-)
Yes and no. You can replace any measure with CALCULATE ( ) However, you cannot replace CALCULATE ( ) with [m] where m := , because the visibility of the variables is different. This has nothing to do with the filter context and the row context, but just with the scope of the variables, that is always local to an expression. I hope it helps!
I really don't see the point of measures. I would always want to see row by row calculations, and if I wanted to see a sum the pivot tables would show that anyway.
For example, this calculation should be in a measure, otherwise it cannot be aggregated correctly in a grand total if calculated row by row: Margin % = [Margin] / [Sales Amount]
@@SQLBI I use Power Pivot exclusively for outputting tables and pivot tables to the workbook and so far cannot find a use for measures. Maybe this is different in Power BI reports.
"you can not use the same code for a Measure and a Column" !! This is why DAX and Power Query didn't turn into a success! No matter how hard MS pushes. Why should a learn 2 langs and techniques for one task ??? Microsoft's failure to see obvious things. Otherwise this is the best, most relevant and robust tool for any Big Data/Data Science.
Well that's frustrating but the fact that power query can't store measures there had to be probably different languages. Also the syntax for measures is quite different from columns which is another annoying thing.


![Noob To Max With DRAGON REWORK In Blox Fruits [FULL MOVIE]](http://i.ytimg.com/vi/LnBMOinoOvA/mqdefault.jpg)
![BLACK BAG - Official Trailer [HD] - Only in Theaters March 14](http://i.ytimg.com/vi/Du0Xp8WX_7I/mqdefault.jpg)


Alberto, your videos are not only super helpful for understanding Power BI and DAX, but I absolutely love your Italian accent when you speak in English! It makes the learning experience even more enjoyable. Grazie for sharing your knowledge with such clarity and charm!
The company I work for is currently switching from Tableau to Power BI. So, I'm coming from 5 years of Tableau experience and having a hard time with Power BI right now. Thank you for your videos thy help me with the transition!
Just found this video and what an eye opener for beginners like me. I always try to create new measure than add a calculated column. This is indeed helpful! Thank you!
Wow this is the best explanation I have seen about this difference
In Power BI, *calculated columns* work row-by-row in the table (using **row context**), so they calculate values for each row and store them. On the other hand, *measures* are dynamic and depend on filters and slicers applied in the report (using *filter context* ).
For example, in the formula `SUMX(Sales, Sales[Quantity] * Sales[Net Price])`, `SUMX` creates a row context for the measure, iterating over each row in the *Sales* table, calculating the sales amount, and then summing it up.
On a different topic *CALCULATE* changes the *filter context* of a measure or expression. It's useful when you want to modify filters or apply conditional logic, like calculating sales only for a specific region or time period. Use it to *change filters* and control the calculation’s context.
**measures* and *calculated columns* behave differently in Power BI, and understanding the **row context** and **filter context** is key to knowing when to use each.
*1. Calculated Columns:*
- A *calculated column* is like adding an extra column in your dataset. It is calculated **row by row** in your table and the result is stored in your data model. This means it has **row context**, which means it can perform calculations at the individual row level.
- Example:
Line Amount Column = Sales[Quantity] * Sales[Net Price]
This creates a new column where, for each row in the *Sales* table, the value of *Quantity* is multiplied by **Net Price**. Every row has its own calculation based on the row context.
- *Use Case*: Calculated columns are ideal for calculations you want to perform **at the row level** and store as part of your data model. For example, if you need to filter or slice by the calculated value, it should be a column.
---
### **2. Measures:**
- A **measure** is a formula used to aggregate or calculate data on the fly. Measures don't store results directly in the data model; they calculate results dynamically when used in a visual (like a chart, table, or matrix). Measures depend on the **filter context**, meaning they calculate based on the filters or slicers applied at a given time.
- Example:
```DAX
Sales Amount Measure = SUMX(Sales, Sales[Quantity] * Sales[Net Price])
```
Here, the `SUMX` function iterates over the **Sales** table (row by row) to calculate the total sales amount. In this case, it is creating a "virtual column" for each row in the **Sales** table where it multiplies **Quantity** by **Net Price** and then sums those values based on the current filter context (such as region, product, or time period).
- **Use Case**: Measures are used for calculations that are **dynamic** and **aggregate data**. If you want the result of the calculation to change based on the filters applied in your report (like summing sales for a specific time period or region), a measure is more appropriate.
---
### **Row Context vs Filter Context**:
- **Row Context** (associated with **calculated columns**): In row context, calculations happen **for each individual row** in the table. For example, when you define a calculated column, it iterates through each row of the table to produce the result.
- **Filter Context** (associated with **measures**): Measures operate with **filter context**, which means they are calculated **based on filters** applied to the data model (e.g., slicers, filters on visuals, or columns). This allows measures to aggregate data dynamically.
### **SUMX and Row Context**:
Yes, you are correct that `SUMX` is a **row context function**. It iterates over the table (in this case, the **Sales** table), and for each row, it calculates the expression (Sales[Quantity] * Sales[Net Price]), giving each row its own context. The final result is the **sum** of all those row-by-row calculations, combining the row context into a **measure** that respects the filter context of the report.
---
### **Key Differences**:
- **Calculated Columns** are static and row-dependent (i.e., they have row context), and the values are stored in the table.
- **Measures** are dynamic, dependent on the filters and context of the report (i.e., they have filter context), and are computed on the fly.
**Conclusion**:
- Use **calculated columns** when you need to calculate values row by row and want to store the result for future use.
- Use **measures** when you need dynamic calculations that depend on the report’s filters or user selections.
Excellent... I am now getting it and ready to learn DAX on a serious note....
Sales Amount Measure = SUMX ( Sales, Sales [Quantity] * Sales, Sales [Net Price] ) 2:39
Line Amount Column = Sales [Quantity] * Sales [Net Price] 4:15
God bless you for all the useful Tips and Tricks you are teaching to us.
4 points summary
1. If you want to slice and dice by a column, use a calculated column
2. If you want to use a filter context, use a calculated column
3. If you want to consume less data for storage, use a measure
4. Prefer measures over a calculated column wherever possible
A measure is evaluated in the context of the cell evaluated in a report or in a DAX query, whereas a calculated column is computed at the row level within the table it belongs to
Calculated columns are computed during the database processing and then stored in the model. Measures are not stored in the model as they are computed at query time and do not use memory
If you need to operate on aggregate values you must create measures,If you need to operate on a row-by-row basis, you must create calculated columns
2. Filter context is used in measure, not calculated column.
Alberto sei un grande! Best explanation so far!
I’ve learned from experience to avoid calculated columns for large fact tables, especially with partitions.
Can you explain why?
Very good and direct to the point. Thanks for this video.
Ciao friends --> got the like! also who couldn't possibly like wonderfully useful content form a person with the last name of Ferrari! amazing video, thank you
Beautiful, this was exactly what I needed clarified! Thank you!
May I call you professor? Thank you professor Alberto for explaining the differences.
Very Clear Explanation... Thank you...
Thanks for explaining the differences.
Amazing information
Where I can find more scenarios on DAX to master it
Can you guide me in this.
OMG, this is 1 + 1 = 2 finally well explained...
I really was hoping that you would show how to turn that calculated column code into a measure
Very nice and able to understand now between computed and measure, well done
Excellent video. Very clear for me. Thanks
I'm somewhat distracted with the accent but nice explanation. No doubt that he is the pioneer of DAX.
Thank you for the explanation. Can you use a measure to create a calculated column? I am trying to get a date value from slicer, and storing the value in a measure. I want to use that date value to create a new column. But I get the same value for all the rows.
Yes, a measure referenced in a calculated column will get the context transition from row context to filter context.
create video, leant alot about the differences. thanks
For some reason measures have always eluded me. This has helped, but I think I still need some practice ^_^
Thanks a lot!, a really good explanation.
I had a question in the interview: where is better to use a calculated column instead of measure and I stucked up. Please help🙏
It depends! But a calc column is necessary only when you use the result as a groupby or filter column.
Great Explanation!!
Great example.. many thanks
Thank you for your video. I am curious if you have Italian accent. 🙂
My question - off the back of this video, why would you use a calculated column instead of pre-calculating this in PowerQuery?
You're right, you should use calculated columns when Power Query would be too expensive - for example computing the value based on the content of other tables could be very slow in Power Query.
Hi, thanks for the explanation. Can you please tell me how did you enable the tabs for Measure tools/column tools? Or is it a third party add-in
When you install the latest version of these tools (DAX Studio, Tabular Editor, Analyze in Excel for Power BI Desktop, ALM Toolkit) that tab appears automatically. Tool links available at www.sqlbi.com/tools/
Could I ask another question, I've just bought your book The Definitive Guide to Dax (2nd Ed) and I'm reading about leveraging the performance between calculated columns and Measures, If you separate your Dataset from your visual model, would that not improve performance if you used Calculated columns vers Measures on your visuals?
From a performance point of view, it's better to keep calculated columns on the same model, not on a remote model. However, oftentimes calculated columns are not required for performance and they just increase model size and slow down refresh. Do your own evaluation!
Awesome logic 😊
i have a customer contract table with start and end date. and i want to sum the sales from the sales fact table ( bêtween the start -end date) for each contract, do you have any suggestion , tried many articles but still not yet have soltuoons
See this: www.daxpatterns.com/events-in-progress/
@@SQLBI but the example given is only 1 fact table so might be easier to do , here I have a 2 table separately : sales orders table , and the other is the "contract table" ( which is like a campaign with start and end date , wanna see the sales during each campaign )
It really depends on many details about the report you want to produce. If there are no multiple active campaign for the same date, you should apply the active campaign to the transaction, if there could be multiple campaigns active for a single transaction you should keep the calculation at runtime. There are several discussions about similar problems in our book, even though not exactly the one you asked for: www.sqlbi.com/books/analyzing-data-with-microsoft-power-bi-and-power-pivot-for-excel/
I'm going to buy this book and learn more, don't know if it helps since the problem not quite the same as you said. Between this book and the defenitive guide to Dax ? which would u recommedn more?
The Definitive Guide to DAX is about the DAX language.
Analyzing Data with Microsoft Power BI and Power Pivot for Excel is about data modeling.
They cover different topics, you need knowledge on both areas. If you already know dimensional modeling (Kimball's methodology) then you only need DAX, but the question you raised is a typical data modeling question!
You can slice and dice a column but it wont have a filter context
I think this needs updating 2:14 you talk about not being able to slice by a measure, I think this is now possible. 😀
You can apply a filter on a visual based on a measure only in the filter pane, but you cannot group by a measure.
@@SQLBI Many thanks for the clarification
Very useful. Thank you.
Thanks for the content, and just for clarification, would like to know this..
The line amount calculated column had same values in the table where as it was still getting huge different incorrect values under the filter context when used in the visual..
I Believe that this is because of the number of rows that gets evaluated in the filter context giving different wrong results, otherwise if rows are equally distributed then we would see same wrong result in the visual.. can you please confirm.
I don't understand your description, please can you try to clarify your question?
@@SQLBI Sorry for that, I was justifying the reason for seeing different values in the visual.. even though same values appear in Calculated column..
@@Bharath_PBI You're seeing different values in the visual because it's being filtered by brand. In each row, it's aggregating the grand total by the total number of rows that contain each brand. So for example, if the number 10 is repeated in the calculated column, and a product of brand X appears 9 times and a product of brand y appears 10 times and there are actually 1000 rows, in this example, brand X will show 90 (9 * 10) and brand y, 100 (10 * 10) whereas the grand total of all brands will be 10,000 (1000 rows with 10 repeated)
I hope this explanation helps.
I'm only a year and a half into this so I'm open to correction.
Calculated tables:
Take up space
Created using operators.
Measures:
No take space
Use DAX
Hi Alberto - my two cents:
A measure is a closed unit of aggregation that returns a scalar result. The input of a measure is the current evaluation context. No row context exists prior to executing a measure.
A calculated column is the result of a DAX expression. The input of a calculated column is a single row row-context. No filter context exists prior to executing the calculated column.
No number of CALCULATEs can make a DAX expression into a measure. Only the DAX engine can do that. It ‘s a closed deal so to speak.
The first two paragraphs are certainly correct. I don't completely understand the meaning of the last one. Can you clarify?
@@SQLBI What I mean is that there is a notion circulating that if you embed a DAX expression in two CALCULATEs that is the equivalent of a measure.
CALCULATE(CALCULATE(expression, filter_1, … filter_n))
The justification for this would be that no row contexts are visible to neither the expression nor the filter arguments.
If this was correct you should be able to reference a variable declared outside a measure from within a measure. So if you have a calculated column with this DAX expression:
VAR aVariable = something RETURN
CALCULATE(CALCULATE(expression * aVariable , filter_1, … filter_n))
and you actually could save CALCULATE(CALCULATE(expression * aVariable , filter_1, … filter_n)) as a measure you should be able to do this:
VAR aVariable = something RETURN
[expressionAsAMeasure]
Obviously you can't. A DAX expression becomes a measure when you save the expression as a measure from a client tool that adds the appropriate Meta data AND the DAX expression is isolated from the outside world except for the current evaluation context.
Measure = { measure metadata + evaluation context + DAX expression }
So a measure is a closed deal (a Closure?).
I probably shouldn't have written the last paragraph in my original comment :-)
Yes and no.
You can replace any measure with CALCULATE ( )
However, you cannot replace CALCULATE ( ) with [m] where m := , because the visibility of the variables is different.
This has nothing to do with the filter context and the row context, but just with the scope of the variables, that is always local to an expression.
I hope it helps!
2:20- you can't use the same expression for a measure as a column.
Clear explaination
thank you. Exceptional.
Good information
How many minutes in one mile
wow.........am in love now DAX
I really don't see the point of measures. I would always want to see row by row calculations, and if I wanted to see a sum the pivot tables would show that anyway.
For example, this calculation should be in a measure, otherwise it cannot be aggregated correctly in a grand total if calculated row by row:
Margin % = [Margin] / [Sales Amount]
@@SQLBI
I use Power Pivot exclusively for outputting tables and pivot tables to the workbook and so far cannot find a use for measures. Maybe this is different in Power BI reports.
Excellent
Thanks
The GOAT
Thanks!
Better explalin: imposible
Salute
I want to eat some pizza!
DAX A DAX A DAX A AMORE MIO
"you can not use the same code for a Measure and a Column" !! This is why DAX and Power Query didn't turn into a success! No matter how hard MS pushes. Why should a learn 2 langs and techniques for one task ??? Microsoft's failure to see obvious things. Otherwise this is the best, most relevant and robust tool for any Big Data/Data Science.
Well that's frustrating but the fact that power query can't store measures there had to be probably different languages. Also the syntax for measures is quite different from columns which is another annoying thing.
latino speaking english is amusing xD
Not a good explanation
Unclear