NDVI calculation from Landsat8 images with Python 3 and Rasterio - Tutorial

HTML-код
- Опубликовано: 5 окт 2024
- Satellite images are georasters, these images are a regular array of columns and rows (a matrix per band) with a georeferenciation. Python is a programming and data analysis language very versatile for the matrix algebra with the Numpy library, however there was no efective and simple way to process a georaster until the development of the Rasterio package.
Rasterio is a library to open, write, explore and analyze georasters in Python. The library uses GeoTIFF images along with other formats and is capable to work with satellite images, digital elevation models, and drone generated imagery.
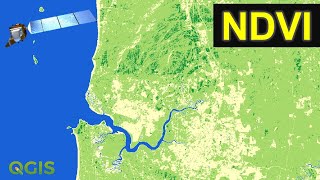
This tutorial show the complete procedure to analyse the NDVI from a Landsat 8 image with Python 3 and Rasterio. The scripting and representation was performed on a interactive enviroment called Jupyter Notebook, finally the result georaster was opened in QGIS and compared with some background images.
Input data
You can download the input data and scripts used for the tutorial on this link:
www.hatarilabs...


This is exactly what I needed, clear and simple! Thank you so much!
Share our blog with your friends
Super helpful video, thank you!
This is apparently helpful. Thank you so much
It's a nice video
Can you please make videos for landuse landcover classification from multiple Landsat 8 images for a specific study area including agriculture, built-up, water bodies, forest , vegetation cover, snow and glacier etc?
We will think about ti!
Excelente video y muchas gracias.
How can we calculate ndvi from multiple images? Can you provide a script?
Are the bands radiometrically corrected prior to ndvi calculation?
Actually I want to ask can we apply ndvi to single plant and get comments if it's healthy or stressed ??
Love your video!
hello sir,
can we stack panchromatic band(b8.tif) with (b2,b3,b4).
if you have a code or any information related to these please reply.
Hola Saul. Es posible con rasterio obtener el corte de un poligono que muestre el NDVI?
Hello, can someone helps me to interprate the last plot (yellow and green) please , how can we read the graph ?
can you save the ndviImage tiff file with cmap ? if yes how?
hello sir,
everytime i try to open such bands using rasterio and print out my arrays using open and read they all come out as zeros. could you help me out with why thats happening?
Did you find the solution ?
Why my code is showing
array ([[0, 0, 0, ..., 0, 0, 0],
[0, 0, 0, ..., 0, 0, 0],
[0, 0, 0, ..., 0, 0, 0],
...,
[0, 0, 0, ..., 0, 0, 0],
[0, 0, 0, ..., 0, 0, 0],
[0, 0, 0, ..., 0, 0, 0]], dtype=uint16)
while representing #raster values as matrix array.
Please guide me.
Seems to be empty on the borders
How to resolve this ?
@@PriyankaSharma-ge9xl Evaluate if you can get results
@@hatarilabs what should i do to get values ? Please suggest.
Hatari, very good job. May God/Allah Bless you.
Can you help me solving a problem: I have images with huge volume with total size being around 25 to 190 GB i have to merge them together whiling taking care of no data value.
Secondly, from same images i want to create TMS(tiled Map Service ) a lighter and faster version of raster for uploading on any platform- that u might be knowing much better than me.
So, could you help in solving these issue.
what kind of merging you want? Kindly clear the problem
Can some here help me to download rasterio lib?
It is pretty easy to download and install
depending on your OS and programming language.
in windows, i would recommend you run these commands:
pip install geopandas
this will install fiona, rTree, rasterio, e.t.c
in Linux open the terminal and run these commands :
sudo apt-get update
sudo apt-get install geoapandas.
this will install fiona, rTree, rasterio, e.t.c
Are the bands radiometrically corrected prior to ndvi calculation?
No