i am attenting it now. Did you by any chance do the assignment I did not like very much the first 2 assignments so I stop doing them and I am currently looking online for some tutorial/project ideas I can code with python (or any language ) in order to be able to apply the techniques learnt in the course to an actual data set. Woul you happen to know by any chance anything that could help me ?


Attended Daphne Koller coursera PGM lecture series earlier... Found few intuitions explained better here... really nice and concise video...
i am attenting it now. Did you by any chance do the assignment I did not like very much the first 2 assignments so I stop doing them and I am currently looking online for some tutorial/project ideas I can code with python (or any language ) in order to be able to apply the techniques learnt in the course to an actual data set. Woul you happen to know by any chance anything that could help me ?
I'm so jealous
1:34:00 The report mentioned by Tom Minka is www.seas.harvard.edu/courses/cs281/papers/minka-divergence.pdf
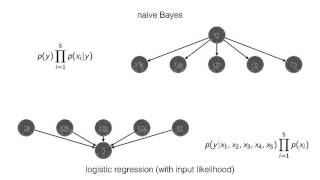
the coin flipping example 24:50 is very illustrative of D-separation
this is amazing! I finally feel as if I am building an understanding of machine learning! thank you so much for uploading this!
super super helpful. Thanks
A very good tutorial for beginner.
Clear explanation. Thanks for sharing.
Recommendable, but lecturer is not very convincing