Lesson 29 (5) Mixed Effect Model Comparing 2 slopes

HTML-код
- Опубликовано: 21 авг 2024
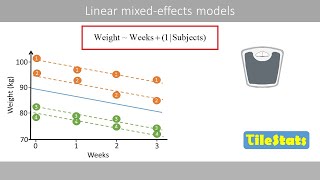
- This video provides a simple introduction of how to use mixed effect regression to compare rate of growth over time between boys and girls with an step-by-step instruction on how to use SPSS.


Thank you so so so much for this video!! You are a life saver! I needed learn this to analyse my confocal data (for my PhD) and I was struggling to make this work on SPSS. But you have saved me many hours of work and many moments of frustration and despair. May the science gods reward you with a great discovery and much fame and fortune!!
I am so glad that you found my video helpful. Good luck with your analysis!
Much needed tutorial!! Thank you
It is a very clear and helpful tutorial! Thank you!
Glad it was helpful!
Sex is a binary variable which I coded 0 (girl) and 1 (boy). Putting Sex in Cov box will compute regression coefficient girl as a reference for boy. Factor will use Boy as a reference. As we typically want to use girl as a reference, I use Cov box rather than Factor box for a convenience. Either is fine when you have a binary covaraite.
Age has 4 categories. If you put Age in Cov, reg-coefficient will give "average increase in Y for evey 1 year increase in Age" this assume linearity.
If you put Age in Factor, we will see 3 regression coefficients, each comparing each Age cetetory to the highest. If you don't want to assume linearity you may put Age in Factor box.
Nice, thanks a lot, is it also possible to do with two data sets, but fitted with a power regression? (F.ex. if you compare the ice cream sale (dependent) with the temperature (independent) in two different countries and you perform a regression analysis and a power regression gives the best R value and therefore want to compare them as power functions).
Thanks for the great video. What if i want to compare slopes of more than 2 groups?
Thanks for sharing the video. I wonder whether neglecting correlation assumptions would bias the results?
WOW!!!! :) Excellent!! I have one question! What if there are several measures for each patient on each time period? As if I were evaluating a variable number of teeth per patient which could have either of two treatments and wanted to consider each tooth as the unit (not the patient). How do I remove between patient variability to evaluate the effect of treatment? Thank you very much!
This is very helpful; thank you. Do you know how to obtain estimated marginal means? It looks like the only option SPSS gives you is OVERALL, which is not terribly helpful-- how would you determine the means for boys vs. girls at each age?
Thx for your video. I would like to ask that why "Age" and "Sex" were not put into "Factor" but "Covariate" instead?
Thanks for the video. I would like to know what can possibly be wrong If FXPRED_1, PRED_1, etc. don't appear after I followed the previous steps. Does anybody know?
Thank you for the video. I would like to ask, if it is possible to estimate effect size (eta2 or any other) in Mixed Models. And if I may ask one more, is it possible to create split-bar-plot (within by between) that counts for all main factors and all interactions? In "Repeated Measures" section of SPSS the plot can be done (hovewer there are no CIs, but it is possible to show margins of error).
Thank you again!
Sincerely,
M.
Martin Marko Sorry, I don't have an answer to this question, at this moment. Will keep an eye for it.