That's a lot of hard work you are putting in to help us Excel enthusiasts. Grateful to you for all the very helpful (and free) tips and material that you provide. Thanks a ton!
I have done my Dashboard and understood the concepts just by seeing this video but it took me 2hours to completely set up as i am doing it for the 1st time, excellent content and Thanks
WOW !!! within 35 minutes you have introduced us to so many elements of pivot table and dash boards. Your sessions are just amazing. A big Thank you in gratitude.
Yes it was uploaded last year! and Yes I have to admit I have learnt quite alot especially about pivot tables table, pivot chart and dashboard and a number of shortcuts and tricks. Many Thanks
Another great dashboard tutorial! This was a complex dashboard considering I have only done the "15 minutes", "interactive" and now this one. But these 3 have increased my skill set substantially!!!!I cannot wait to do my next dashboard!!!!
I didnt need to learn it for my job, but now I will, because I just watched your video from my sofa in the evening and it was entertaining and perfectly explained. I also like to learn new things
This is fantastic because my job has partial data, it has to be captured at a certain time or the info changes to the next quarter. Something like this will help us to keep track more often than once a quarter.
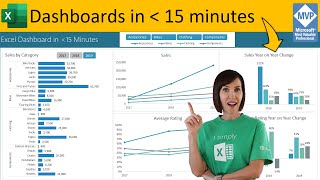
Another great tutorial. Thank you Mynda. Personally, I'm not a fan of dark backgrounds as I find them harder to read but that's just me. Your content is always top notch.
Also not a fan of dark backgrounds in dashboards, especially loaded dashboards like this example. I like dark backgrounds in other apps/settings (e.g., PowerPoint, mobile phone, Kindle), but I find dark dashboards difficult to read.
This is where I ended up when looking for insight on income and expenses excel files. I bit overkill for my needs with this file, but.... LETS GOOOOOOO - hahaa. You really make me love excel with each video you make. Thanks!!
WOW! I have been an Excel user and VBA "tinkerer" for many years and this video (and your web site) is amazing!! I'm totally blown away with how you made an incredible dashboard and with your super instruction. Thank you!!
Amazing tutorial Mynda. Lots of great tips even for power users (and I pretend being one of them) so I had to pause and rewind many times. The color combination (gradients of blue) is so beautiful and relaxing to the eyes compared to some other dashboards that look like a parrot. I would nominate you for the Nobel prize of Dashboard creation, if it ever existed! One question though: How many of these green T-shirts you have? because in each tutorial I feel like it's a brand new one :) Thanks again for sharing your outstanding knowledge.(Nabil Mourad)
Wow, that's awesome to hear. Of course, your hard work is what really transformed your life 😉 I'm just glad my tutorials have been useful. Please share them with your friends and co-workers.
Another fantastic video. As an alternative for "=If" variance indicators you could, when modifying the pivot table number format to use [ALT+Numpad 30] for Up triangle, and [ALT+Numpad 31] for Down triangle. e.g ▼* 0.0%;▲* (0.0%) Adding this in the pivot table formatting makes this format available in the ribbon number format. Using this format allows you to keep the variance % as a number instead of a string.
Yep, great idea. You could even go one further and use: [Color10]▼* 0.0%;[Red]▲* (0.0%) You can play around with colours 1-56, or use the 8 standard by name (although I find the 8 standard quite harsh, apart from the red, which is okayish).
@@ApteryxRex yes, good idea. I have a workbook saved somewhere, but I probably only use a few of the colours so just know them. It's a shame Excel never extended the use of them and allowed a colour index, and reproduced the simple +;-;0;@ formatting formula for cell shading. I've also never understood why cell formatting and conditional formatting are not part of the same dialogue box. But there we go!
I'm 3 years late but that was brilliant. Not only the outcome but the way you taught it, it was so good! I can immediately use this in my work. Thank you so much. T
Thank you very much for your hard-working and great effort put into the dashboard. Another extremely helpful one as always from your channel practically helps me to build a complete planning vs actual performance model. I'm trying to combine this one with the project management to arrive at a complete set of project dashboards visualizing project milestones and financial status. Wish you health and success in your career:)
Simple and straight-forward ways to come up with an awesome dashboard again, Mynda. Congratulations. Kindly throw some light on the difference between actual, forecast and plan. How is the plan and forecast different? Maybe a bracket/ parenthesis issue again
The plan or budget is done before the actuals start coming in. The forecast is an update of the plan/budget once you have some actual data and updated knowledge as to how you expect the future to pan out.
If you were just doing the work you'd be working at an astounding pace and efficiency. To be doing so while also narrating video......just wow! Excellent!
This. Is. Awesome. This is just what I have been searching for. Always was a pivot table fan and you just made it so easy to go to the next level!! Sharing with my team.
So pleased it was useful! You should create the dashboard in Excel. You can then embed it in PowerPoint if you want, but I don't recommend it. See this video on embedding Excel Dashboards in PowerPoint: ruclips.net/video/WgpfiVGs6qc/видео.html
Howdy. Thank You i have watched all your videos and they are awesome. I gained a lot of skills in excel because of your videos. Ill suggest your channel for to my friends.


"before we get started, i just wanna set your expectations for this tutorial..." all yt tutorials should begin with this. nice tutorial!
Pleased to hear that. Thank you :-)
You are fantastic. I need more tutelage with the slicers and their connections
@@MyOnlineTrainingHub
Your channel should have like 10 million subscribers. Every proffesional should watch your videos.
You are amazing , thanks a lot
Thanks for your kind words! Please share our channel with you friends and colleagues 😊
That's a lot of hard work you are putting in to help us Excel enthusiasts. Grateful to you for all the very helpful (and free) tips and material that you provide. Thanks a ton!
My pleasure, Prasad!
I have done my Dashboard and understood the concepts just by seeing this video but it took me 2hours to completely set up as i am doing it for the 1st time, excellent content and Thanks
Congratulations on building your own dashboard!
I love your Dashboards. I’ve shamelessly used your layouts and ideas a number of times, keep up the great work.
Awesome to hear, Graham :-)
WOW !!! within 35 minutes you have introduced us to so many elements of pivot table and dash boards. Your sessions are just amazing. A big Thank you in gratitude.
Glad you found it helpful, Saritha!
Great stuff, love your choice of fonts and colours, very modern and eye catching
Glad you like them, Brian!
Yes it was uploaded last year! and Yes I have to admit I have learnt quite alot especially about pivot tables table, pivot chart and dashboard and a number of shortcuts and tricks. Many Thanks
Great to hear, Jon!
Another great dashboard tutorial! This was a complex dashboard considering I have only done the "15 minutes", "interactive" and now this one. But these 3 have increased my skill set substantially!!!!I cannot wait to do my next dashboard!!!!
So pleased to hear that, Sherry!
I didnt need to learn it for my job, but now I will, because I just watched your video from my sofa in the evening and it was entertaining and perfectly explained. I also like to learn new things
Wonderful to hear, Julian!
You pay attention to detail and presentation, more than just numbers, I love that!
Thanks so much :-)
This is fantastic because my job has partial data, it has to be captured at a certain time or the info changes to the next quarter. Something like this will help us to keep track more often than once a quarter.
Great to hear!
Another great tutorial. Thank you Mynda. Personally, I'm not a fan of dark backgrounds as I find them harder to read but that's just me. Your content is always top notch.
Cheers, Ben! I'm not really a fan of dark backgrounds either, you may have noticed that this is my first :-) I thought I'd give it a go for a change.
Also not a fan of dark backgrounds in dashboards, especially loaded dashboards like this example. I like dark backgrounds in other apps/settings (e.g., PowerPoint, mobile phone, Kindle), but I find dark dashboards difficult to read.
Mynda, you are GREAT! This dashboard is so useful. And to think that you made it in around 30 minutes is inspiring.
So pleased to hear that, Steve!
Perfect, i have french version of office 365, and i apply everything you say in french mode , thank you, all your dashboards have helped me so much
Awesome to hear, Hicham!
L9€_+^!90894₩3))88)
m3allem!
This is where I ended up when looking for insight on income and expenses excel files. I bit overkill for my needs with this file, but.... LETS GOOOOOOO - hahaa. You really make me love excel with each video you make. Thanks!!
So glad it was helpful, David!
Looking forward to playing around at work tomorrow!!
Have fun!
WOW! I have been an Excel user and VBA "tinkerer" for many years and this video (and your web site) is amazing!! I'm totally blown away with how you made an incredible dashboard and with your super instruction. Thank you!!
Thanks for your kind words, Mike!
Amazing tutorial Mynda. Lots of great tips even for power users (and I pretend being one of them) so I had to pause and rewind many times.
The color combination (gradients of blue) is so beautiful and relaxing to the eyes compared to some other dashboards that look like a parrot.
I would nominate you for the Nobel prize of Dashboard creation, if it ever existed!
One question though: How many of these green T-shirts you have? because in each tutorial I feel like it's a brand new one :)
Thanks again for sharing your outstanding knowledge.(Nabil Mourad)
Thanks for visiting, Nabil and your kind words! I only have one Excel t-shirt and one day it will wear out :-D
You’re Excel Goddess 🙏🏻
You’ve transformed my life and the way I used excel
Wow, that's awesome to hear. Of course, your hard work is what really transformed your life 😉 I'm just glad my tutorials have been useful. Please share them with your friends and co-workers.
Another fantastic video. As an alternative for "=If" variance indicators you could, when modifying the pivot table number format to use [ALT+Numpad 30] for Up triangle, and [ALT+Numpad 31] for Down triangle. e.g ▼* 0.0%;▲* (0.0%)
Adding this in the pivot table formatting makes this format available in the ribbon number format. Using this format allows you to keep the variance % as a number instead of a string.
awesome tip!
Yep, great idea. You could even go one further and use:
[Color10]▼* 0.0%;[Red]▲* (0.0%)
You can play around with colours 1-56, or use the 8 standard by name (although I find the 8 standard quite harsh, apart from the red, which is okayish).
Awesome tips, Justin & Rico! Thanks for sharing.
@@ricos1497 I usually keep a list of the colours and example of, in a hidden workbook that resides in the xl start folder, an easy reference.
@@ApteryxRex yes, good idea. I have a workbook saved somewhere, but I probably only use a few of the colours so just know them. It's a shame Excel never extended the use of them and allowed a colour index, and reproduced the simple +;-;0;@ formatting formula for cell shading. I've also never understood why cell formatting and conditional formatting are not part of the same dialogue box. But there we go!
I'm 3 years late but that was brilliant. Not only the outcome but the way you taught it, it was so good! I can immediately use this in my work. Thank you so much. T
Awesome to hear!
Thank you very much for your hard-working and great effort put into the dashboard. Another extremely helpful one as always from your channel practically helps me to build a complete planning vs actual performance model. I'm trying to combine this one with the project management to arrive at a complete set of project dashboards visualizing project milestones and financial status. Wish you health and success in your career:)
Thanks for your kind words! And to you 😊
I am so addicted to this kind of dashboard & especially your work. Thank you so much ❤
Aw, awesome to hear!
You never cease to amaze me, I love all your tutorials. You really deserve the MVP. Great Thanks Mynda.
Thank you so much, Nassim!
.
Это просто праздник какой-то! Очень красиво получилось,спасибо.
Glad you liked it!
Wow, this is the best dashboard I've ever seen, really amazing...♥
Thanks so much, Reda! Please share it with your co-workers too :-)
Simple and straight-forward ways to come up with an awesome dashboard again, Mynda. Congratulations. Kindly throw some light on the difference between actual, forecast and plan. How is the plan and forecast different? Maybe a bracket/ parenthesis issue again
The plan or budget is done before the actuals start coming in. The forecast is an update of the plan/budget once you have some actual data and updated knowledge as to how you expect the future to pan out.
Thank you so much. It is so valuable, everything looks so neat.
Glad you think so!
If you were just doing the work you'd be working at an astounding pace and efficiency. To be doing so while also narrating video......just wow! Excellent!
Thanks for your kind words, Michael!
Wow, great lesson, I have gone through it time and again, very encouraging...
I'm for it.
Wonderful to hear!
And when you also add Power Query into your study , all process works like a Power BI reports. Amazing study !!!
Thank you, Alpay :-)
Wow. I love dark themes :-D
THX a lot !!!
Great to hear, Jack!
Great work dear
I just don't get why this would have any thumbs down, another incredible tutorial, thank you.
Thanks for your support, Volker!
Great Lesson enjoyed the power of excel in your tutorials
Great to hear, Lewellyn!
You're just awesome, I followed all the steps and built it. I loved the information and the teaching skills. God Bless You.
Congratulations, Roy! Glad my tutorial was helpful :-)
One of the best tutorial I've ever come across. You are the best, Ms. Mynda Treacy.
Wow, thank you, Yuva!
Oh dear Lord, Mynda. You are *AMAZING*. Not only are you extremely informative but I could listen to your dreamy voice all day long. :)
Thanks for your kind words, Thom!
Although i just fucus on this vedio for few minutes, i realise this channel and the instructor are great.
Thanks
I appreciate that!
Love, love, love your channel. Learning so much about advanced Excel from you. Thank you and good wishes
Great to hear!
I have to say - you are a wizard (meant in entirely positive way :-)). I learnt a lot and got really inspired. Thank you
Wow, thank you!
This is indeed amazing... I have learnt learnt so much excel in the past couple of days than I have ever before. Thanks.
Great to hear 😊
Godsmacked!!! Thank you, Mynda . Another brilliant tutorial
Thanks so much, Craig!
Love people who make things look that easier. Great job!
Thank you! 😊
You are amazing , thank you for making it so simple to understand and with a short time to keep our minds alert🙌
So pleased you enjoyed it!
This. Is. Awesome. This is just what I have been searching for. Always was a pivot table fan and you just made it so easy to go to the next level!! Sharing with my team.
Awesome, thank you, Richard!
You are star teacher. Dashboard that I built (watching your earlier video) is more or less a standard across my work place. Thank you.
:-) thanks so much, Kamalesh!
Absolutely brilliant teaching course. I got detailed insight step by step about Interactive Dashboard. Thank You
Glad it was helpful, Ammad! Please share it with your co-workers :-)
One of the best excel tutorials Ive ever seen. Thank you.
Wow, thanks so much, Tyler!
dashboard looks amazing...so clean
Thanks so much!
Simply loved the way you explain the things. Fortunate to get quick learnings from regular videos. Thanks a lot Mynda.
You're very welcome, Unmesh!
Excellent work. Thank you. Best tutorial. Clear, straight, stuctured, Wow.
Thanks so much, Frank!
This is perfect I have been looking for a way to create dashboards like this for years
Could you create this in PowerPoint?
So pleased it was useful! You should create the dashboard in Excel. You can then embed it in PowerPoint if you want, but I don't recommend it. See this video on embedding Excel Dashboards in PowerPoint: ruclips.net/video/WgpfiVGs6qc/видео.html
Wow - What a presentation and the way you explained is fantastic. Thank you very much
Glad you enjoyed it, Lakshmipathi!
Blessings for you and your family !
Glad you liked my video 😊
Excellent insights ; Learnt new and easy way to manage. Thanks
Glad you enjoyed it!
Thank you so much. Life has been made so easy through your training. Keep on the good excel work. Thumps up for you
So pleased to hear that, Jacob!
Your All Tutorials are great, you always give more information in less time. Thanks a lot.
Glad you like them!
Absolutely love this channel. It’s easy stuff that I have never worked with before but super easy to learn.
So pleased to hear that, Armita!
I thought this was done using complicated macros. It looks really professional. Good job
Glad you enjoyed it :-)
Truly exceptional … brilliantly useful. Thank you
Thanks so much, Simon! Keep your eye out for my latest dashboard tutorial coming this week!
One day I want to be a great Excel expert like you. So impressive. 😊😊
So pleased you found my video helpful, Crystal!
Really nice explanation and fast. Ideal for Excel-teachers and Excel-fans. Thank you.
Glad you think so!
Awesome. The way you explained was as good as the dashboard.
Glad you liked it :-)
Always amazing. You are the best trainer.
Wow, thank you!
This is a marvelours tutorial!!!! THUMP UP!!!! an excel user from China! CHEERS!!!👍
Glad you think so!
your tutorials are awesome.. makes my report very professional.. big WOW!.. easy to understand and follow.. thank you so much ms.minda tracy.. :)
So pleased you like them, Mimi :-)
@@MyOnlineTrainingHub
i did!
I like your explanation every level step by step. I will going on following to you. Thank you for your help us 👏
Glad it was helpful!
Your dashboards look really awesome. You are really creative with excel. Very unique and really smart. Good work.
Thank you very much, Aravind! Glad you're enjoying them.
YOU ARE A GEM MYNDA!
Thanks so much! 😊
Wonderful explanation for stepping up from novice to professional. Thx.
Glad you enjoyed it!
Best video on Excel I've ever seen.
Wow, thanks so much!
Very awesome ! , your technique of creating dashboards with excel is very well
Glad it was helpful, Abdelkader!
video is very informative which helped me alot to developed my own dashboard.
Great to hear!
Mynda - this is the best one yet! I absolutely love it
Thanks so much, Dylan!
Excellent presentation! The information was presented very logically.
Glad you enjoyed it, Arnold!
Howdy. Thank You i have watched all your videos and they are awesome. I gained a lot of skills in excel because of your videos. Ill suggest your channel for to my friends.
So pleased to hear that, Surya!
Thanks a lot for explaining so nicely.
My pleasure 😊
Beautiful dashboard and yours explanation is jewel in the crown ...
Thanks, Irfan!
Can't believe it ,first look reflecting toward Power Bi. Cool stuff and simple steps.
Thanks
So pleased you liked it, Ali :-)
Totally Amazing! You're so genius!
Thanks for sharing your knowledge!😀
Thanks for your kind words! Glad you enjoyed it.
thank you, just subcribed and let all the ads running to express my gratitude
:-) thanks so much, Hang!
That's one superb way to help people ..... Keep up the good work...✌✌
Thank you so much 😀
Very good your tutorial. Going to help me in design e build of the dashboard. Thanks you for sharing us knowledge.
Glad to hear that!
Many thanks for your great tutorial. I learned a bunch of new things that enables me to use pivot and excel more effectively
Great to hear!
Well Done Mynda
Lots Of Information .......................In every video u r doing awesome tricks
Thanks, Ashish 😊
@@MyOnlineTrainingHub ur channel have awesome information with lots of knowledge
Dashboards to the next level. Very sleek. I love it
Glad you like it!
This is incredible! Such a great tutorial thank you!! Going to be rewatching this a lot.
Glad it was helpful, Matt!
Very thorough tutorial. thank you
Glad you enjoyed it!
All your tutorials are amazing and very informative!
And great job on the design ;)
🙏 Glad you think so!
This is really some hardcore teaching
Hope you found it useful 😊
I truly appreciate your lessons. Keeps my excel skills sharp
Glad to hear that!
Such a nice dashboard and a nice presentation as well. Keep up the good work. We are always with ya.
Thanks so much, Hunter!
Thank you so much for your sharing. Very creative and easy to understand.
Glad it was helpful!
It's just fantastic... So much thank you from India...
Glad you liked it!
Thank you very much for sharing your knowledge!
My pleasure 😊
Perfect as always, my to go you tube channel for any excel inquiry
Great to hear!
Waiting for a video of a dashboard for tracking expenses..
Amazing tutorials 👌
Thank you!
Very nice and informative. will build the same Dashboard myself.
Great to hear, Abhishek!
This is amazing! This is my first time watching and cannot wait to practice. Thank you so much for this content!
So great to hear! Have fun building your own dashboard.