Riding the Yield Curve and Rolling Down the Yield Curve Explained

HTML-код
- Опубликовано: 30 июл 2024
- Ryan O'Connell, CFA, FRM explains riding the yield curve and rolling down the yield curve. This will be particularly useful for CFA Level 2 candidates.
📚 CFA Exam Prep Discount - AnalystPrep:
► Get 20% off CFA Level 1, 2, and 3 complete courses with promo code "RYAN20". Explore here: analystprep.com/shop/all-3-levels-of-the-cfa-exam-complete-course-by-analystprep/?ref=mgmymmr
🎓 Tutor With Me: 1-On-1 Video Call Sessions Available
► Join me for personalized finance tutoring tailored to your goals: ryanoconnellfinance.com/finance-tutoring/
👨💼 Freelance Financial Modeling Services:
► Custom financial modeling solutions tailored for your needs: ryanoconnellfinance.com/freelance-finance-services/
💾 Download Free Excel File:
► Grab the file from this video here: ryanoconnellfinance.com/produ...
Chapters:
0:00 - Intro to Riding the Yield Curve
0:28 - Conditions Necessary to Ride the Yield Curve
1:51 - Valuing a 5 Year Bond After Two Years
6:18 - Valuing a 6 Year Bond After Two Years
7:56 - Why the Yield Curve Must Be Upward Sloping
Disclosure: This is not financial advice and should not be taken as such. The information contained in this video is an opinion. Some of the information could be wrong. This channel is owned and operated by Portfolio Constructs LLC. Some of the links above are affiliate links, meaning, at no additional cost to you, I will earn a commission if you click through and make a purchase.


![CENTRAL CEE - GEN Z LUV [VERTICAL VIDEO]](http://i.ytimg.com/vi/VIbidJm9q34/mqdefault.jpg)

📚 CFA Exam Prep Discount - AnalystPrep:
► Get 20% off CFA Level 1, 2, and 3 complete courses with promo code "RYAN20". Explore here: analystprep.com/shop/all-3-levels-of-the-cfa-exam-complete-course-by-analystprep/?ref=mgmymmr
🎓 Tutor With Me: 1-On-1 Video Call Sessions Available
► Join me for personalized finance tutoring tailored to your goals: ryanoconnellfinance.com/finance-tutoring/
💾 Download Free Excel File:
► Grab the file from this video here: ryanoconnellfinance.com/product/riding-the-yield-curve-excel-workbook/
Thank you buddy, this video and your explanation was truly helpful and easy to understand. Giving out the excel you created for free is also such a nice gesture. Keep up the good work!
You're welcome and it is my pleasure! I hope it helps you understand the topic. Btw, most of my Excel-based videos have a free download link so please feel free to check out some of the other ones
For Bond 1, I get YTM as 5.76%; 5.82% is for 7-year rather than 5-year
You are right about that! That was the one mistake I made in this video. The concept still stands as shown however. And the free downloadable file shows the updated values
Was having a tough time understanding Fixed Income in CFA L2. This helped a ton!
It's my pleasure, glad it helped!
Perfect demonstration! Thank you
Glad it was helpful!
Thanks Ryan! Great video.
Much appreciated Joey!
Excellent video! Really clarified it for me.
Glad it was helpful!
Best one till now.
These videos are so useful Ryan. Thank you very much.
It is my pleasure!
Hi Ryan I have emailed you my version of this. Also you have included n =7 for bond 1 while computing rate. It should actually be 5.
Thank you Shivam, just saw your email! I'll take a deeper dive when I have some time. And yes, you are correct about n. Although the logic in the video is still accurate despite that mistake
Thanks bro I was struggling with this rolling down curve thing, you did the job now I understood how does it work,
Really glad to hear it helped! Sometimes laying all the calculations out clearly can really make it click. At least that is how I learn the best
Phenomenal explanation. Thanks Ryan
It is my pleasure! Thank you for the support
Thankyou for clearing a concept i have been failing to understand since a very long time.
My pleasure Zaid. Are you a CFA Level 2 candidate?
@@RyanOConnellCFA Yes. Appearing in August this year.
Best of luck! I used the same numbers that they used in the CFA Institute books for the Riding the yield curve topic for this example if that helps
Thanks for clearing this doubt . So basically for a rolling yield strategy to work spot rate should be upward sloping. And the return for a longer duration will be higher than for a short duration.
Yes, Kavita, you have got it! Don't forget the assumption that the spot curve stays relatively the same and does not turn into the forward curve
@@RyanOConnellCFA got it now. Make video on capped coupon rate and floored rate also.
@@kavitabatra4537 Awesome. I will likely get to that concept in the future but it may not be out for a while
@@RyanOConnellCFA alright sir. And please explain the concept of one side duration or make a video on the same
Nice explanation!
Glad it was helpful!
Hey Ryan, thank you so much for the video.
My pleasure!
Hey Ryan, Great Video, just wondering why we don't reinvest the coupons of the standard bond where we don't ride the yield curve ? Thank you.
Hey Daniel, you tell by the formula in cell C8 that we are reinvesting the coupons of the standard bond as well
You think you can do a video on measuring foreign exchange exposure? Such as finding translation gain(loss) using the current rate method with translation exposure
Hey Chris! I can look into this. Just a warning though, I have a lot of videos in the queue so it will likely not be for a while
Is this roll down pnl based on assuming the term structure is unchanged, or realizing the forwards?
Thanks for the detailed explanation. One question- why did you take N=7 in bond 1 to calculate the YTM? If we are taking 5th year spot rate as coupon, then shouldn't it be discounted for 5 years?
I believe the number fo years in that rate formula should be 5 there! Good catch. I changed it and the concept still applies. The new YTM is 5.77% which is still lower than the 6% spot rate. For anyone reading this, we are talking about @3:30
@@RyanOConnellCFA ues yes, it didn't have any material effect. I was just confused looking at the 7.Thanks for the video, helped me understand the concept clearly.
@@AmolMY My pleasure AmoL!
legend
Much appreciated!
Thank you , just a question , is Riding the Yield Curve and Rolling Down the Yield Curve the same meaning ?
Yes Miguel! It is just two terms that mean the same thing
Can you explain the formula for the total return of bond 1 and 2 (L6 and L15)?
The formula is simply the present value of the cash flows divided by the original amount that we paid for the bond. This gives us a two year return. We than take the square root to get a 1 year return. Finally subtract by one to get the result as a percentage
Thanks. Now I understand. It's similar to forward rate calculation. So L6 is solving for TR from the followings 1/(1.06)^5=1/[(1.03)^2(1+TR)^3]
@@firebirdies Yes, you got it! That is exactly right
Why are we discounting Bond 1 $5.88 cash flow by 2% and not 4% (@4:50)? Aren't we currently at the begining of year 3?
Hello, at that time stamp we are valuing the bond two years in the future assuming that the yield curve did not change since the beginning of the time period two years prior. So we are at the beginning of year 3 of the whole timeline, but the applicable interest rate us the same as the interest rate beginning year ,1 two years ago
Thanks for this. Much appreciated@@RyanOConnellCFA
Why did you compute in to the power of .5?
I'm guessing that you are referring to @6:06 . This is because we have two years worth of compounding returns in that formula. So to convert it back to the annual return we need to take the two years of returns to the power of 0.5
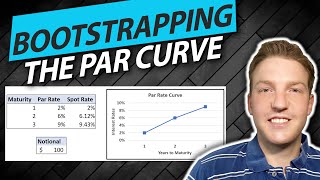
I think you forgot to mention the par curve and that's how you get the coupon payment.
Coupon payments isn't derived from spot curve.
Hello KD. We are not deriving the coupon payment from the spot curve in this video. We are just taking the 6% coupon as a given. In this example, the coupon rate has nothing to do with the par curve, it is simply an example of an outstanding bond that has a 6% coupon rate. Does that make sense?
@@RyanOConnellCFA Thanks yes I understand that you've taken the coupon pmt as a given
Why would you assume spot rates would remain same after 1 year. If forward curve is a predictor of spot rate, shouldn't spot rate after 1 year (S1) be 4.52% that is equal to 1 year forward, one year from now ( 1y1y)
Legen .. Wait for it . . Daaarryyy
Haha I love Barney Stinson!
Why discount the Bond 1 for 7 years for the YTM?
That is the one mistake I made in this video! Bond 1 should use 5 years instead of 7 years in the YTM calculation. The concept as shown still stands and the result is not materially impacted by the mistake
Why can't I value the bond after 2 years using the forward rates of 3rd, 4 th, and 5 th yrs.
Manish, you could definitely do that with an adjustment to the formula
The funny thing is in CFA L2 book they have not discounted future cashflows with correct spot rates which is causing a lot of confusion. There is an error in the calculation there. THanks a lot!
Wow, that is crazy to have an oversight like that! Hopefully people will find this video more relevant going forward then. Thanks for letting me know! And its my pleasure
thats actually ocrrect to do so; Reusing the initial year 1 spot rate would result in incorrect pricing since it does not account for the updated interest rates for the remaining periods.