Double Exponential Decay Data Fitting Using Microsoft Excel

HTML-код
- Опубликовано: 10 сен 2024
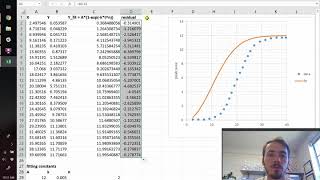
- In this tutorial video, I have shown the process of an experimental data/curve fitting with a double exponential decay function using Microsoft Excel. The exponential decay function used here is:
y(t) = Aexp(-mt)+Bexp(-nt)
Here, the total sum of squares (SST), residual sum of squares (RSS), R-square, and adjusted R-square have been found. The regression analysis has been done by minimizing residual sum square using an Excel solver and for the solving process with some additional constraints. The use of the $ command in Excel has also been depicted in this video. I Hope, this data analysis video tutorial will be useful to experimental physicists, chemists, engineers, biologists, economists, and many others. Please subscribe to this channel.
Related Books:
Experimental Electrochemistry: A Laboratory Textbook by Rudolf Holze
Link: amzn.to/3wTjWtq
Solid State Electronic Devices by B. Streetman and S. Banerjee
Link: amzn.to/3cmDtJg
Electrochemical Impedance Spectroscopy (The ECS Series of Texts and Monographs) by Mark E. Orazem and Bernard Tribollet
Link: amzn.to/30pf8jn
Impedance Spectroscopy: Applications to Electrochemical and Dielectric Phenomena Hardcover -
by Vadim F. Lvovich
Link: amzn.to/3nmRi0I
Electrochemical Impedance Spectroscopy and its Applications Paperback by Andrzej Lasia
Link: amzn.to/3nm3U8g
Hey! I am now making videos using the Samsung Galaxy S6 tab. It's highly recommended to use. If you are a grad student you can have this pocket-friendly one. You can use a cool keyboard alongside, which will facilitate ease of working.
Link of this tab in amazon.in: amzn.to/3Fr00B5
Keyboard for Galaxy S6: amzn.to/3Hxmx0Y
Pocket-friendly iPad: amzn.to/3Ficawa
Here's the amazon link to my new Dell Inspiron 3501 laptop: amzn.to/3FilqjU
Facebook Page: / ayansarkaryoutube


16:13
Sorry! I did mistake there! The K shell value corresponding to A+B=should have been written as =$K$3+$K$4, instead of just 1.
And the constraint A+B=1 can thetefore be obtained by setting that $K$10 value equal to 1.
Thanks for demonstrating how to find an equation from data. I was able to follow it all the way though to find a formula for my own data.
Glad to know that.
awesome video Dr. Ayan👌👌👌👌😎😎😎🐱🏍🐱🏍🐱🏍
Hi Hi...
Is there a way to calculate the half-life from the fitted data?
Great, but how do you estimate the curve decay rate? Mathematically, you have two decay rates, but the data has one. How to estimate the data decay rate from the fit function you have created?
Sir I have a time constant of 62.8 and I have to find a best fit exponential line for the x and y graph . The curve is negative exponential line! x are in between 420 to 560 and y are 0 to 3. Will you please find a function for this?
The stats portion of this process can be done in one step using the SUMXMY2 formula which calculates the sum square difference between the observed and fitted data. This can be minimized to find the fitting parameters.
Thanks for sharing your knowledge.
Hi. Great video. i have watched your video and im learning to do this too. I have one question. At 4.44, how you got all those values? A, B, m & n? Sorry for troubling you.
Well, due to some internet related problem, I am writing you using my mobile. Firstly, the values of A, B, and n were chosen arbitrarily. Then the values were tuned by the Excel solver to fit properly with the given equation (double exponential decay in this case). So, you can choose those values as you wish, but it is better to choose the values having some physical significance.
Also substitute (1-A) for B and only fit three parameters.
Can this be done without solver?
No, I think.
@@AyanSarkar1 Thanks for the reply, I managed to download the
thanks for the quick reply and downloaded the extension. Does this have any limitations in terms of the value of the numbers?
Im using to analyse current decays and working with values in the order of nA, would this cause an issue? its just because my fit is nothing like the experimental data sadly
@@davidnicol4150 I reckon you should not face any problem. You may work with the values of currents only, keeping nano Ampere as the unit. For an example, say you have I= 4.56 E-9 A. You can work with 4.56 only, keeping E-9 as the multiplication factor. I think I also used current in the order of micro Ampere.
@@davidnicol4150 Here, in this video, I used a ratio. However, in actual case, I used currents in micro ampere scale. You can see our latest publication in the Chemical Engineering Journal, 2020, 127227, by N. G. Ghosh, A. Sarkar, S. S. Zade.
You could have save time using logest or linest function.
I never used those functions. Thank you for your suggestion.