Sensitivity, Specificity, False Positives, and False Negatives in SPSS

HTML-код
- Опубликовано: 22 авг 2024
- This video demonstrates how to calculate sensitivity, specificity, the false positive rate, and the false negative rate using SPSS. These constructs are often used in the evaluation of assessments and screening tools.


Even though SPSS scares me, these videos are very informative. I have never been aware of a false positive and false negative and the way it was described by you makes it very simple! I know I don’t need this information now, but this will come in handy in future research projects that I hopefully have data to apply it to.
Sir Grande is awesome...He clarifies each and every bit very crystal clear...Thanks sir...
This video has allowed me to easily understand these terms in a visual representation. It will benefit my future research findings by presenting statistics with components of sensitivity, specificity, type 1 errors, and type 2 errors.
The cross tab is giving the 2*2 table where we can put True Positive(TP) ,False Negative(FN) ,False Positive (FP)and True Negative(TN) for further calculation the Sensitivity will be by the formula TP/TP+FN, Specificity by TN/TN+ FP .
Thanks, Dr. G. That made it seem so very simple.
thanks for great video! Could you also share video/ link to calculate 95% CI for FR and FP?
thank you for this amazing very simple explanation and I'd like to ask about how to calculate predictive values using spss
Thank you so much for this information, it is so valuable to me
I'm wondering if I can calculate the 95% CI of sensitiviy, NPV, and PPV using SPSS.
BTW thank you very much for your vedio! That's really useful.
Thanks very much for your very concise and informative video
You're welcome, thanks for watching -
That was really nice presentation, I have doubt, how we will process the variables with more than two levels
Excellent video. Thank you!
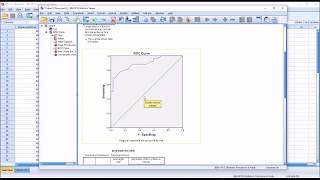
Is it possible to plot this data on an ROC curve?
Any ideas on how to proceed in the case of 4x4 table?
Excuse me, I want to ask. Is it possible if the results are all positive but different positive 1, 2, 3, and 4? to determine the sensitivity and specificity of the urine protein examination method. Thank you, I hope you can read my question sir
Great vid!
But I wonder; why or why not would you like to use Cohen's kappa when calculating sensitivity and specificity? Is that only applicable when you have 2 observers and want to check their agreement (a radiologist vs. a gynecologist on the presence of a uterine tumor for example) or can you use Cohens kappa to check the agreement between a test and the reality as well?
Also, when and why is McNemars test used in this context? I know it can be used on paired nominal data, but isn't calculating sensitivity and specificity always a matter of paired data?
Somehow the reality is also determined by a test (a patologist evaluation on a surgery specimen), which can be faulty, but we take it on face value because we have to believe something i true, the gold standard.
?can I plot ROC curve in this case
hello , how can i deal with negative values in spss? when i transfere negative values into spss it disappears while positive values appears. please help!!
What test do you use to compare this though ? is it a A McNemar chi2 test ?
you have just made it everything crystal in 7 min, when any other video is just time consuming flowing info
I'm glad you found the video useful. Thanks for watching.