SPSS: How to identify an optimum Cut-Off Point on a Psychometric Scale - Part 2

HTML-код
- Опубликовано: 21 авг 2024
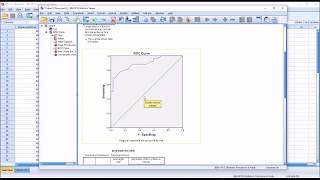
- This short video details how to find an optimum cut-off point on a Psychometric Scale using IBM SPSS. In particular, the video details how to generate a Receiver Operator Characteristics Curve and using a measure of Sensitivity and Specificity find an optimum scale cut-off point. This cut-off point maximising the True Positive and True Negative detection rates.


Thanks a lot Sir for explaining so candidly and in detail. You have a high level of energy which helped me understand better.
Brilliant
Finally I get it
Btw SPSS 28 puts a red arrow at cut off making it easier
Many thanks
Your explanation is just an amazing one
BIG Thank you from Germany!
I understand how you use the graph to try and find optimal point. But from the table, why not choose the threshold with 1- Spec of 0.157 instead? Does that not indicate higher specificity but the same sensitivity, hence improved accuracy?
Yes it does
Great video. Thank you.
Thank you very much ! It was so helpful
Thanks from Bangladesh!
No problem from Ireland, Utsav. It would be great if you could share with your class mates. Thanks. Jonathan.
Great explanation, thank you very much.
Thanks so much for this great video. Is there a way to choose which cut-off thresholds appear in the analysis table? For example, I've just created a ROC curve and all of the cut-offs in the table are 0.5s (e.g. 1.5, 2.5, 3.5). Is it possible to change the cut-off thresholds to whole numbers (i.e. 1, 2, 3, 4 etc) instead?
That was helpful, for sure!
Thank you for explanation, very useful.
Thank you for the tutorial, it really helps!
Just curious, can ROC analyse help in determining 3 cut-off points such as low, medium, and high?
Hi. I haven't seen it used that way, as the response variable is typically binary. However, you could break your data into two sets. The first containing the score classified as low and medium, you could then do a ROC analysis on that. Then create a dataset with the medium and high classified data, and then do a ROC on that. That should allow you to create two cut-off points across the full dataset. Regards. Jonathan
thank you soo much sir for this video!!
you identify the optimum Cut-Off Point by hand not by spss !!!
Thank you for this video. Where can I find the Youden index in SPSS?
Thanks a lot sir for explaining. I have a question though: my chief asks me to compute the ROC analysis for two predictors for an event x and to compare their performance in AUC and also by using the Wald test for AUC. how to compute the latter in SPSS? thank you!
SPSS tell me that the WEIGHT variable contains at least one fractional value that is not appropriate..any one know what can i do?
For the optimal cut off point can you generate confidence intervals for the sensitivity and specificity? Great Video
Hi Ansaar. You can indeed but not directly through the SPSS ROC interface. You could calculate them through their appropriate formulae but maybe just visit this page: www2.ccrb.cuhk.edu.hk/stat/confidence%20interval/Diagnostic%20Statistic.htm for a calculator. Thanks for watching and please subscribe and recommend to friends. Thanks.
Thank you so much it was a nice comprehensive video but i would like to know how to compare between more than one test thanks in advance
A million thanks for this helpful video. Why not 0.196 but 0.176? 0.196 more closer to 0.2 than 0.176.
Best regards
It's actually wrong choice in the video.You want to maximise your specificity for your sensitivity. There are 4 points where the sensitivity is 0.833, so you want to choose the lowest 1-specificity for that point which is 0.157 (a specificity of 0.843). The point chosen in the video (0.176) will give you a lower specificity (0.824) for the same sensitivity so will be less accurate. Your choice of 0.196 (specificity 0.804) is even less accurate
cut off point is 3.85, couse it will be more specific and same sensetive