What is Normal Distribution in Statistics ? How to solve Normal (Gaussian) distribution problems ?

HTML-код
- Опубликовано: 1 июл 2024
- This short animated video explains the concept Normal distribution also known as Gaussian distribution. Also discussed in this video is the empirical rule and characteristics of Normal distribution and how to solve normal distribution problems with live examples.
If you like it please share this with your friends.
🎭 𝐒𝐮𝐛𝐬𝐜𝐫𝐢𝐛𝐞 𝐦𝐲 𝐘𝐨𝐮𝐓𝐮𝐛𝐞 𝐂𝐡𝐚𝐧𝐧𝐞𝐥 : / digitalelearning
📹 𝐒𝐭𝐚𝐭𝐢𝐬𝐭𝐢𝐜𝐬 𝐕𝐢𝐝𝐞𝐨𝐬
------------------------------------------------------------------------------------------------
🎬 𝐏𝐨𝐢𝐬𝐬𝐨𝐧 𝐃𝐢𝐬𝐭𝐫𝐢𝐛𝐮𝐭𝐢𝐨𝐧 : • Poisson Distribution i...
🎬 𝐒𝐢𝐦𝐩𝐥𝐞 𝐋𝐢𝐧𝐞𝐚𝐫 𝐑𝐞𝐠𝐫𝐞𝐬𝐬𝐢𝐨𝐧 : • What is Simple Linear ...
🎬 𝐒𝐭𝐮𝐝𝐞𝐧𝐭'𝐬 𝐭-𝐭𝐞𝐬𝐭 : • What is Student's t-te...
🎬 𝐀𝐍𝐎𝐕𝐀 (𝐀𝐧𝐚𝐥𝐲𝐬𝐢𝐬 𝐨𝐟 𝐕𝐚𝐫𝐢𝐚𝐧𝐜𝐞) : • What is ANOVA (Analysi...
🎬 𝐁𝐢𝐧𝐨𝐦𝐢𝐧𝐚𝐥 𝐃𝐢𝐬𝐭𝐫𝐢𝐛𝐮𝐭𝐢𝐨𝐧 : • Binominal Distribution...
🎬 𝐂𝐞𝐧𝐭𝐫𝐚𝐥 𝐋𝐢𝐦𝐢𝐭 𝐓𝐡𝐞𝐨𝐫𝐞𝐦 𝐒𝐭𝐚𝐭𝐢𝐬𝐭𝐢𝐜𝐬 : • What is Central Limit ...
🎬 𝐂𝐡𝐢 𝐒𝐪𝐮𝐚𝐫𝐞 (χ𝟐) 𝐝𝐢𝐬𝐭𝐫𝐢𝐛𝐮𝐭𝐢𝐨𝐧 (𝐆𝐨𝐨𝐝𝐧𝐞𝐬𝐬 𝐨𝐟 𝐅𝐢𝐭) : • What is Chi Square (χ𝟐...
🎬 𝐏-𝐯𝐚𝐥𝐮𝐞 𝐢𝐧 𝐡𝐲𝐩𝐨𝐭𝐡𝐞𝐬𝐢𝐬 𝐭𝐞𝐬𝐭𝐢𝐧𝐠 : • What is P-value in hyp...
🎬 𝐍𝐨𝐫𝐦𝐚𝐥 𝐃𝐢𝐬𝐭𝐫𝐢𝐛𝐮𝐭𝐢𝐨𝐧 𝐢𝐧 𝐒𝐭𝐚𝐭𝐢𝐬𝐭𝐢𝐜𝐬 : • What is Normal Distrib...
🎬 𝐓𝐲𝐩𝐞 𝟏 𝐄𝐫𝐫𝐨𝐫 𝐕𝐬 𝐓𝐲𝐩𝐞 𝟐 𝐄𝐫𝐫𝐨𝐫 𝐢𝐧 𝐒𝐭𝐚𝐭𝐢𝐬𝐭𝐢𝐜𝐬 : • What is Type 1 Error V...
🎬 𝐒𝐜𝐚𝐥𝐞𝐬 𝐨𝐟 𝐌𝐞𝐚𝐬𝐮𝐫𝐞𝐦𝐞𝐧𝐭 𝐢𝐧 𝐒𝐭𝐚𝐭𝐢𝐬𝐭𝐢𝐜𝐬 : • Scales of Measurement ...
🎬 𝐇𝐲𝐩𝐨𝐭𝐡𝐞𝐬𝐢𝐬 𝐓𝐞𝐬𝐭𝐢𝐧𝐠 : • What is Hypothesis Tes...
🎬 𝐇𝐲𝐩𝐨𝐭𝐡𝐞𝐬𝐢𝐬 𝐓𝐞𝐬𝐭𝐢𝐧𝐠 𝐒𝐨𝐥𝐯𝐞𝐝 𝐏𝐫𝐨𝐛𝐥𝐞𝐦𝐬 ? • Hypothesis Testing Sol...
🎬 𝐂𝐨𝐧𝐟𝐢𝐝𝐞𝐧𝐜𝐞 𝐈𝐧𝐭𝐞𝐫𝐯𝐚𝐥 𝐢𝐧 𝐒𝐭𝐚𝐭𝐢𝐬𝐭𝐢𝐜𝐬 : • Confidence Interval in...
🎬 𝐒𝐚𝐦𝐩𝐥𝐢𝐧𝐠: 𝐒𝐚𝐦𝐩𝐥𝐢𝐧𝐠 & 𝐢𝐭𝐬 𝐓𝐲𝐩𝐞𝐬 : • Sampling: Sampling & i...
📹 𝐋𝐞𝐚𝐧 𝐒𝐢𝐱 𝐬𝐢𝐠𝐦𝐚 𝐕𝐢𝐝𝐞𝐨𝐬
------------------------------------------
►Lean Manufacturing : • What is Lean Manufactu...
►Lean Vs Six Sigma : • Lean vs Six sigma (6 s...
►Value Stream Mapping : • What is Value Stream M...
►Quality Function Deployment : • What is Quality Functi...
►Six Sigma (6 Sigma) : • Six Sigma (6 sigma) | ...
►8 Lean Manufacturing wastes: • 𝟴 𝗪𝗮𝘀𝘁𝗲𝘀 𝗼𝗳 𝗟𝗲𝗮𝗻 𝗠𝗮𝗻𝘂𝗳...
►5S Methodology: • What is 5s methodology...
►GEMBA Walk : • What is Gemba : Where ...
►SIPOC Diagram: • What is SIPOC diagram ...
►Lean Pull vs Push : • Lean Pull vs Push | Ju...
📹 𝐐𝐮𝐚𝐥𝐢𝐭𝐲 𝐓𝐨𝐨𝐥𝐬 𝐕𝐢𝐝𝐞𝐨𝐬
-----------------------------------------
►7 Basic Quality tools : • What are the 7 basic q...
►FMEA (Failure Modes & Effect Analysis) : • What is FMEA (Failure ...
►Fishbone Diagram : • What is Fishbone Diagr...
►5 Why Root Cause Analysis: • 5 Whys Root Cause Anal...
►Quality Assurance vs Quality Control : • What is the difference...
►Plan Do Check Act (PDCA cycle) : • What is PDCA - Plan D...
📹 𝐏𝐫𝐨𝐣𝐞𝐜𝐭 𝐌𝐚𝐧𝐚𝐠𝐞𝐦𝐞𝐧𝐭 𝐕𝐢𝐝𝐞𝐨𝐬
-------------------------------------------------------
►What are SMART Goals? : • SMART Goals settings -...
►Project Charter Basics: • What is Project Charte...
►Benchmarking : • What is Benchmarking ?...
►5W1H : • What is the 5W1H Metho...
►BCG Matrix : • BCG Matrix in Straterg...
⏱️ 𝑻𝒊𝒎𝒆 𝑺𝒕𝒂𝒎𝒑 ⏱️
------------------------------
0:00 - Introduction
00:36 - What is Normal Distribution ?
03:18 - 3 Sigma rule or Empirical Rule ?
04:26 - Standard Normal Distribution ?
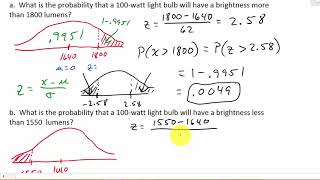
05:29 - Example #1 of Normal Distribution
07:45 - Example #2 of Normal Distribution
10:03 - Example #3 of Normal Distribution
11:32 - Quiz time
📢📢 𝑶𝒖𝒓 𝑺𝒐𝒄𝒊𝒂𝒍 𝑴𝒆𝒅𝒊𝒂 𝑳𝒊𝒏𝒌:
--------------------------------------------------
🐦𝐓𝐰𝐢𝐭𝐭𝐞𝐫 : / digitalelearni1
📸 𝐈𝐧𝐬𝐭𝐚𝐠𝐫𝐚𝐦 : / digital_elearning
📩 𝐓𝐞𝐥𝐞𝐠𝐫𝐚𝐦 : t.me/digital_e_learning007
🙋🏻♂️ 𝐏𝐢𝐧𝐭𝐫𝐞𝐬𝐭: / digitalelearning007
📚 𝐋𝐢𝐧𝐤𝐞𝐝𝐈𝐧 𝐩𝐫𝐨𝐟𝐢𝐥𝐞 : / digitalelearning
🙋🏻♂️𝐋𝐢𝐧𝐤𝐞𝐝𝐈𝐧 𝐏𝐚𝐠𝐞: / 55180987
🙋🏻♂️𝐅𝐚𝐜𝐞𝐛𝐨𝐨𝐤 𝐏𝐚𝐠𝐞 : / digitalelearni1
💌 𝑪𝒐𝒏𝒕𝒂𝒄𝒕 𝒖𝒔 : digital.e.learning007@gmail.com for any business/ promotion queries.
✍️ 𝓓𝓲𝓼𝓬𝓵𝓪𝓲𝓶𝓮𝓻:
Copyright Disclaimer under section 107 of the Copyright Act of 1976, allowance is made for “fair use” for purposes such as criticism, comment, news reporting, teaching, scholarship, education and research. Fair use is a use permitted by copyright statute that might otherwise be infringing. The information contained in this video is just for educational and informational purposes only and does not have any intention to mislead or violate Google and RUclips community guidelines or policy. I respect and follow all terms & conditions of Google & RUclips.
𝐂𝐨𝐦𝐦𝐨𝐧 𝐊𝐞𝐲 𝐬𝐞𝐚𝐫𝐜𝐡 𝐫𝐞𝐥𝐚𝐭𝐞𝐝 𝐭𝐨 𝐭𝐡𝐢𝐬 𝐭𝐨𝐩𝐢𝐜 :
----------------------------------------------------------------------
#Digital_e_Learning #normaldistribution #statistics #sixsigma #leansixsigma
how to solve normal distribution problems
What is Normal Distribution in Statistics ?
What is meant by normal distribution?
What is normal distributions with examples?
properties of normal distribution?
Introduction to Normal Distribution
Basics of Normal Distribution
Examples of Normal Distribution
Solved questions and answers on Normal Distribution
Normal Distributions (Bell Curve)
Normal Distribution and Standard Norma


![Megan Thee Stallion - Otaku Hot Girl [Official Audio]](http://i.ytimg.com/vi/USxIYOaIpig/mqdefault.jpg)


👀 Hello Friends, 𝐉𝐨𝐢𝐧 my 𝑺𝒐𝒄𝒊𝒂𝒍 𝑴𝒆𝒅𝒊𝒂 𝑳𝒊𝒏𝒌 for regular updates:
------------------------------------------------------------------------------------------------------------------
📸𝐈𝐧𝐬𝐭𝐚𝐠𝐫𝐚𝐦 : instagram.com/digital_elearning/
🐦𝐓𝐰𝐢𝐭𝐭𝐞𝐫: twitter.com/DigitalELEARNI1
📢𝐓𝐞𝐥𝐞𝐠𝐫𝐚𝐦 : t.me/digital_e_learning007
🙋🏻♂𝐖𝐡𝐚𝐭𝐬𝐀𝐩𝐩 (𝐋𝐞𝐚𝐧 𝐬𝐢𝐱 𝐬𝐢𝐠𝐦𝐚) : whatsapp.com/channel/0029VaAUuqs4inooet3e4S3O
🙋🏻♂𝐖𝐡𝐚𝐭𝐬𝐀𝐩𝐩 (𝐒𝐢𝐱 𝐒𝐢𝐠𝐦𝐚 (𝟔σ ) : whatsapp.com/channel/0029VaEWKWbIiRovZpAduc0p
🙋🏻♂𝐖𝐡𝐚𝐭𝐬𝐀𝐩𝐩 (𝐒𝐭𝐚𝐭𝐢𝐬𝐭𝐢𝐜𝐬 & 𝐑𝐞𝐬𝐞𝐚𝐫𝐜𝐡) :whatsapp.com/channel/0029VaAGwzTDJ6H9S5Q4Ow0m
🙋🏻♂𝐖𝐡𝐚𝐭𝐬𝐀𝐩𝐩 (𝐏𝐫𝐨𝐣𝐞𝐜𝐭 𝐌𝐚𝐧𝐚𝐠𝐞𝐦𝐞𝐧𝐭) :whatsapp.com/channel/0029Va8slQdEAKWAhXoQK13B
🙋🏻♂𝐖𝐡𝐚𝐭𝐬𝐀𝐩𝐩 (𝐐𝐮𝐚𝐥𝐢𝐭𝐲 𝐀𝐬𝐬𝐮𝐫𝐚𝐧𝐜𝐞 & 𝐐𝐮𝐚𝐥𝐢𝐭𝐲 𝐂𝐨𝐧𝐭𝐫𝐨𝐥) :whatsapp.com/channel/0029VaAKJBGKGGGDjcK4mw2h
Watch speed recommendation 1.5x
👀 Hello Friends . How is this video ? Comment below . You can also Suggest me any new topic my for next video ..!
Sir 1st problem lower value 150-160/10
Upper value 170-160/10 urs change the values sir
Yes brother... you are right.. surprisingly no one addressed this.. but yeah.. never mind...
The explanation was crystal clear btw...
If not for your videos, i would have never understood this topic!
Thank you so much sir.
Glad to hear that
Thank you sir, you finally made me understand the concept for Bell curve
🎬 𝐇𝐲𝐩𝐨𝐭𝐡𝐞𝐬𝐢𝐬 𝐓𝐞𝐬𝐭𝐢𝐧𝐠 ? ruclips.net/video/UXV-A0Zo1Jk/видео.html
🎬 𝐏-𝐯𝐚𝐥𝐮𝐞 𝐢𝐧 𝐡𝐲𝐩𝐨𝐭𝐡𝐞𝐬𝐢𝐬 𝐭𝐞𝐬𝐭𝐢𝐧𝐠 :ruclips.net/video/xdZSWsKk5P0/видео.html
🎬 𝐍𝐨𝐫𝐦𝐚𝐥 𝐃𝐢𝐬𝐭𝐫𝐢𝐛𝐮𝐭𝐢𝐨𝐧 𝐢𝐧 𝐒𝐭𝐚𝐭𝐢𝐬𝐭𝐢𝐜𝐬 : ruclips.net/video/WPj4yuwdInc/видео.html
🎬 𝐂𝐨𝐧𝐟𝐢𝐝𝐞𝐧𝐜𝐞 𝐈𝐧𝐭𝐞𝐫𝐯𝐚𝐥 𝐢𝐧 𝐒𝐭𝐚𝐭𝐢𝐬𝐭𝐢𝐜𝐬 : ruclips.net/video/BIlH-sIYo-8/видео.html
🎬 𝐓𝐲𝐩𝐞 𝟏 𝐄𝐫𝐫𝐨𝐫 𝐕𝐬 𝐓𝐲𝐩𝐞 𝟐 𝐄𝐫𝐫𝐨𝐫 𝐢𝐧 𝐒𝐭𝐚𝐭𝐢𝐬𝐭𝐢𝐜𝐬 : ruclips.net/video/X8M_KIKlcjQ/видео.html
🎬 𝐒𝐚𝐦𝐩𝐥𝐢𝐧𝐠: 𝐒𝐚𝐦𝐩𝐥𝐢𝐧𝐠 & 𝐢𝐭𝐬 𝐓𝐲𝐩𝐞𝐬 : ruclips.net/video/BIlH-sIYo-8/видео.html
🎬 𝐇𝐲𝐩𝐨𝐭𝐡𝐞𝐬𝐢𝐬 𝐓𝐞𝐬𝐭𝐢𝐧𝐠 𝐒𝐨𝐥𝐯𝐞𝐝 𝐏𝐫𝐨𝐛𝐥𝐞𝐦𝐬 ? ruclips.net/video/K6wNyoDdRSk/видео.html
🎬 𝐒𝐜𝐚𝐥𝐞𝐬 𝐨𝐟 𝐌𝐞𝐚𝐬𝐮𝐫𝐞𝐦𝐞𝐧𝐭 𝐢𝐧 𝐒𝐭𝐚𝐭𝐢𝐬𝐭𝐢𝐜𝐬 : ruclips.net/video/3BuJjrLDsNY/видео.html
you made stats simple, easy . Thank you for sharing
Thanks 😎
This much hardwork is praiseworthy .. thank you soo much sir . ❤
Most welcome 😊
Why we didn't subtract 0.5 from the z score at example 3 ?
Thank you sir ..... Explain this topic first answer is B,(mean)
Second answer is b( 1.0)
Third answer : c, (mean=median=mode)
1 b
2 b
3 c
Sir in last question I think we should have to add 0.5 also because 0.8 is from 500
Well explained sir .. much beneficial ... Plz make more videos on stats about binomial distribution, sampling, probability, Bayes theorem....
Thanks 😎 Keep watching 👍
It's very helpful Sir Thank you Soo much...It's my presentation Topic
Glad you like it. Please share this with all your friends as well
1.Ans: MEAN
2.Ans: 1.0
3.Ans: MEAN=MEDIAN=MODE
Correct
Excellent video sir .Thankyou from Pakistan
Welcome 🤗
Good presentation of the content.Thankyou.
So nice of you
Seriously I enjoyed... Thank you Sir.
Thanks Abdul
Thanks, i enjoyed it.
Thanks Sackey 😊
Enjoyed how you broke this down!
Thanks Shurnita 😎
Here calculating Z170 it should be 170-160 instead of 170-180. Right ?
Please do more statistical concepts videos 🙏 your explanation is awesome
Thank you so much 😀 Surr will add
Yes please
Thanks sir
Thanks Chinmay
There is mistake in calculation of z for for standard normal distribution example
Test of significance more problems please
Sure Bhoomi will upload more
In first example 180 kaha se aaya ..?
Mean
1
Equal
1 b
2 b
3 c
For the 1st Q the answer will be B, For 2nd Q. Ans will be B and for the 3rd Q the answer will be C. Thank you
Correct Mekuria
B,B,C
Correct 👍
Tysm sir....ans is- b,b,c
1 b
2 b
3 c
Thank you! Cheers! ❤
b,b,c is correct
Correct
Q:1 answer is c
Q:2 answer is b
Q:3answer is c
Thank you! Cheers! ❤
1 b
2 b
3 c
1-b
2-b
3-c
Awesome, Thank you!❤
1 b
2 b
3 c
1) option b
2) option b
3) option c
1 b
2 b
3 c
1 b
2 b
3 c
Q1) B
Q2) B
Q3) C
1 b
2 b
3 c
1 b
2 b
3 c
Q1 b (mean), Q2 a (zero) ,Q3 c
area under the curve is 1.0
1 b
2 b
3 c
Q1. Ans: c
Q2. Ans: b
Q3. Ans: c
1 b
2 b
3 c
1 b
2 b
3 c
1.B 2. B 3. C
Correct
This video is Not useful at all, it just irritates me.🥵
why do you substract 0.5?