Mixed effects models with R

HTML-код
- Опубликовано: 15 сен 2014
- A video showing basic usage of the "lme" command (nlme library) in R. In particular, I compare output from the lm() command with that from a call to lme().
Here comes the R code used in this tutorial:
library (nlme)
data(Oats)
str(Oats)
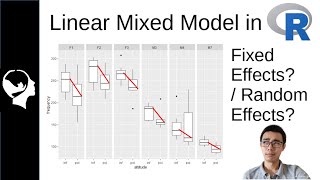
plot(Oats)
model1=lm(yield~Variety*nitro,data=Oats)
summary(model1)
model2=lme(yield~Variety*nitro,data=Oats,random=~1|Block/Variety)
summary(model2)
coef(model1)
coef(model2)
plot(ranef(model2))
plot(model2)


Wow - This is one of the best explanations of mixed models I have seen. Good Job!
I had been looking for tutorial of GLMMS for hours, and this video was the first one having data set illustration while carefully explaining the concept. Great work Mr. Scherber.
You are very good in explanation. Everything is clear. The speed is convenient and the content well-addressed. Thank you very much!
This was the best video ever to explain this concept to me!! THANK YOU!!
Thank you. Your video are so valuable. :)
Can't wait for more. Many many thanks again
Thank you for this video, it is super useful that you are explaining it with R and using an example!
Great video, thank you very much for explaining this topic in a simply way.
Great tutorial! I know mixed effects models fairly well, but I did learn a few new things from this video, just like you suggested might happen. Thanks for posting this!
Thank you for the great video. I enjoyed following along with you - thanks for using the available data
simple, compact and great explain about mixed random effect. thanks!
Thanks, very helpful
Very effective approach to understand for beginners, Thank You!
From 🇧🇩
Learned a lot from this one, thank you!
its a great video to learn Mixed Effect Model
Amazing video! Congratulations! Thanks!
Thanks so much for this great tutorial, I understand many things I would like to watch a video with repetitive measure data
Great video - thanks for creating!
Very didactic and informative, thank you !
This video was very helpful. Thank you so much!
Thanks for your video, very useful
This is great!
Thanks :)
Great video, thanks!
Muchas gracias por el video. Me fue de mucha utilidad.
very helpful and clear style! would be good to have a followup video about how to visualize the data with this sort of model.
Thank you! Very didactic!
it's a really helpful video, thank you very much
thank you this was wonderful!
Thank you so much! You are the best!
This saved me!! Thanks a lot!!
Thank you for the video!
Very nice video, thank you
THX Chris, Gr8 video :)
Thank you very much !
Hi, I find this video very helpful!
I have a question: how do I perform specific comparisons after running a mixed effect model? I have one explicatory variable, a factor with 6 levels, and want to make specific comparisons amongst them
Thank you :)
Thanks
Hi Christoph,
thanks for the video! I had just one question: how do you determine which fixed factor has an effect? In your example is it the nitrogen or the variety? Do you use summary(model2) or anova(model2)? Thanks!
+Anouk Spelt summary and anova test very different things. In summary, you see marginal effects (tested in presence of all others), while in anova() you see sequential tests. You would usually use anova() and try different orders of terms to see which one is always significant. You can also work out the individual R2 values of all predictors to assess their individual explanatory power.
Hi there, I'm busy doing my MSc in Zoology and had to do something similar to understand the which aspect of my study (in this case temperature exposure) had a significant effect. There is a wonderful package out now call emmeans that will do a Tukey post-hoc test on the model to provide a pairwise comparison between your data of respective treatments. I know that this may be 4 years too late, but I hope this helps you or others with a similar question.
very nice video tutorial...I have two questions. in the summary of the model the intercept is significant, what does it mean? in my data, in the random effects model I get the same intercept value for the terms...
Thanks for this video! Quick question: I am currently studying the effect of chocolate on users ability to perform a memory test over the course of 3 days as a longitudinal study. They receive the same amount of chocolate to eat and must perform the same test each day. I was wondering if this code would be appropriate for this situation?
You´d usually need to account for repeated observations on subjects (longitudinal data).
Best wishes
Christoph
Golden rain, I didn't know it was going to be that kind of party.
Thank you very much, your video helped me a lot. I'm from Brazil but I live in Portugal. I'm starting the Mixed Models in PHD studies and your video helped me. You have some video using variables binarias answer? I would like to know if the coefficients are analyzed in the same way we do in logistic regression. Thank you very much. God Bless
Hi Christoph
Thanks for this video!
But I have one question. How to operate data not from areas, but from linear objects?
(e.g. the change in the content of chemical elements along the river bed. There are tendencies to increase the content of chemical elements along the current. However, how to confirm this (or disprove) statistically?)
Thanks Chistoph for the great explanation. 1. In this model how can we check the accuracy of the model when we have test data with us.
2. Can we apply other non linear , tree based and other ensemble models too
Thanks for the great video. I am still confused about one thing. When would you use "lmer()" versus "aov()"? Can you run aov and add in a mixed effect?
+Arun Jani You use aov mainly for balanced designs with equal replication. If you have a random effects structure, you can use the Error command: aov(y~x+Error(a/b)), but this is only possible if you have no missing values and no missing treatment combinations.
Great
Thank you very much for the clarification, Christophe. Your videos are very helpful
Hi Christoph,
Thanks for the video! Are you planning on doing a video explaining post-hoc tests that can be applied to the mixed effect models?
+Thomas Sewell the best way to do this is using contrasts. The multcomp package is also a good place to start.
Nice explanation..Christoph.. Can you suggest the use of mixed linear models for a unbalanced data.. varieties of three different maturities like early, medium and late that are variable across the years (few being common across years)? How to proceed in such case? Any suggestions please
A nice video. Thank you very much.
I have a question: I collect samples in 4 sites (S), each site 5 trees (T), each tree 3 height levels (L), each height level at 3 positions (P) to measure Wood Density. ( T is random effect; S,L and P are fixed effects). How to fit model to test affect of S, T/S, L, S*L, P, S*P, P*T(S), L*P, L*P*S, L*P*T(S)? and how to estimate effect percentage of these above predictor variable to dependent variable (Wood Density)? Please help me.
Hi Christoph! Nice tutorial However, I got stuck at 9:00, when you did plot(Oats). An error pops up displaying "Error in device.call(..) " Do I have to install some other package to for the plot function to work?
+Ashwini Ramesh Dear Ashwini, this may depend on the system you´re working on. If it is windows-based, you may need to re-install R. Best wishes,
Christoph
I forgot this question, sorry. Why the degrees of freedom decease so much between the intercept and the other variety types? and why the interactions have higher df than the varieties alone?
Hi!Could you do an example of lme with weighting factors ? Would also be lovely to see one of where the resulting function (and plotted line) of the lme does not properly fit the data set, are there transformations that can be done in that case? Thank you for your videos they're great :)
hello, thank you for this video. i have a question... when use a particular distribuition on the model? like poisson or gama?
Hi, this video is so good and useful for me, I have a question, in the result of this model on my data , residual plot shows is not fitt( the distribution of oats is not looking like the star in the sky), who do I improve it? is there any reference? so thanks
mahnaz
Hi Christoph, excellent video! I have a doubt, how do I decide whether to use lme or lmer? Thanks in advance!
this is not easy to answer. Usually, I´d say lme is more stable and has more options (e.g. to incorporate also correlation structures). So if I personally have the choice I use lme.
Hello, thanks for the tutorials, I would like to ask for your help how to plot exponential relationships such as that of biomass and tree Dbh. Please help me out!
Thanks for this nice video. I have two questions
1- What does mean correlation of fixed effects? variance-covariance matrix or slopes deviation form the intercept?
2- Looking (+, *, :) between variables why (Response~ Categorialvariable*Continuousvariable, random = ~ 1 | Block) figure out different results at the individual level or interactions level compared to (Response~ Categorialvariable:Continuousvariable, random = ~ 1 | Block )? the ":" symbol does mean interactions too?
Hi Mr. Scherber
, can you tell how to calculate the effect size for each explanatory variables in the HLM? I mean each, not the overall model (i.e., partial eta square)? Really appreciate it!
Very useful tutorial! I really appreciate it! Do you eventually plan to upload a second video on the subject with the rest of the tricks you promise us in the end of the video? ;)
sure, which ones would you be most interested in?
@@ChristophScherber Sorry for the late response! I would really like to see how the variance components of a random effect are calculated! This is something I cannot figure out easily, since most papers or books are heavily in matrix notation and this is not my strong point! Am looking forward to hearing from you!
hi chris tks for this excellent expl. 1 Question: Why you dont take in both model NITROGEN as a factor? tks
this is usually a matter of choice - depending on whether you want to focus on the numbers or the factor levels
Thanks for a nice informative video on mixed model, How can I extract coefficients both for fixed and random effects and plot them
the best way to do this is to use the coef() command
Hello Chris, thanks for the explanation. Please, how can I perform a post hoc test for RMLL?
Hi Christoph,
The content was amazing and did elucidate the concept well. Could you please share the location of the Oats dataset for exploration?
the dataset can be loaded using the nlme library:
library(nlme)
data(Oats)
Are you able to make the 6 plots because the database is structured in such a way that R intuitively knows that which variables are nested? Can a flat dataframe give you this as well?
your videos are great. I have a question:
sometimes I see that instead of "random = ~ 1 | Block/Variety " it is written something else but not a 1, for example "random = ~ Variety | Block" (I don't know if this particualr example makes sense). So, the question is: what does the "1" mean here and why we can write some other things (groups) there?
Thank you very much! :)
auroatle Hi, the difference is that ~1|term means that a different random intercept is fitted for each level of term, while ~variable|term means that different slopes for variable and different intercepts for term are fitted.
+Christoph Scherber That is crystal clear explanation. Can you explain more about "/". I have seen in many cases which only have ~1|Random Var. Why we have to put /Variety there?
This is a great and helpful video. I have one question, what the different between generalized additive mixed model and mixed effect model?
Please explain me, what kind of the data that can use generalized additive mixed models?
Anyone here can help me?
Thank a lot
Sorry for being late, but i have three questions: 1) Is it possible to have the same variable as random and fixed in the same model? Wouldnt they compete? 2) What prevents me from modelling Yield~Variety*nitro for each of the six blocks individually? 3) What if the slope of the fixed effects vary really strongly? I hear there is something like random intercepts, random slope models, but to me this calls for modelling each of the random effect levels individually.
(1) yes, variables can be (and often are) both random and fixed as long as they´re not at the top level of the design
(2) that would increase the probability of a type I error (false positives) as you´d run more tests on the same dataset. But of course sometimes these blocks are interesting by themselves (e.g. different countries), where you´d treat them as fixed.
(3) there are random slopes that you could fit using ~slope|intercept.
Best wishes
Christoph
Dear,
I would like if it was possible that the Lord would help me in a review, lest it incur in error.
If it were a simple logistic regression, I could use The Area Under an ROC Curve, but since I'm using a generalized linear mixed model with reply Binaria, can analyze the same way this output?
If not, what would you suggest?
Thank you
Sugestion: I should make a video showing the comands and the model structures of de repeated measures design. Thanks
+Victor Fioreze OK, will do next time!
This is such a great tutorial, it is very clear and helpful!
I just have two questions: (1) How are the data organized in the original file to ensure that R picks up on the plots and subplots design? (2) What happens if the random effects are not spread symmetrically?
Thank you very much!
+Zu Dienle Tan Dear Zu Dienle Tan, R doesn´t really "know" how the plots/subplots are arranged. You need to tell this to R explicitly using the random effects structure in lme. Non-symmetrical random effects can be made symmetrical using a varIdent variance function. Best wishes, Christoph
Awesome information thanks for sharing. But this experiment is a split-plot design and the model you have used is I guess for complete randomized design. To my knowledge the lm model for split plot should be
model
Hey, It is clear and very helpful video, I wonder if some one helps me how can i find his more videos. thanks
@Christoph Scherber If you read this, Can you tell us why you've stopped uploading videos? You are really helpful for the community and we'd like to see more of you!
Great video.
I have 5 varieties, 4 Nitrogen concentrations, Two Site, 3 years.
we had a drought in one year.
this is the model im thinking of using. Any suggestions please.
M
Hello Prof Scherber, do you have more videos on lme ie more examples- thanks
Handy!
You have the code of the simplifying lines in R
When I run: model2=lme(yield~Variety*nitro,data=Oats,random=~1|Block/Variety)
I get the error: Error: unexpected input in "model2=lme(yield~Variety*nitro,data=Oats-"
Any recommendations?
usually it helps to run the whole line once again.
say the same experiment is carried out in 3 locations, for 3 years. Lets say location is kept random and so is years. How can this be modelled into the model?
Hello prof, can you help me how to run hybrid choice model simultaneously using R?
Sir,
I have a dataset with three factors - season (monsoon, post monsoon and pre monsoos), test duration (4d and 7d- sub samples of each season), sites (1, 2 and 3 with three replicates/sites). Two test durations (4d and 7d-) are from each season. I wanted to see if the response (effect- continuous data) changes with regard to site, season, duration, and their interactions.
Some online forums on statistics suggested me to go on with Repeated Measures ANOVA, but the problem is that since replicates are randomised within each station,
I have little chance to collect the sample from exactly the same spot in successive seasons (for example, repl-1 of station A of post-monsoon may not be the same as that of monsoon). It is unlike the clinical trials (with within-subject design) where you measure the same subject repeatedly over seasons. Hope you will help me in finding out a valid solution.
I used the following command and recieved a warning message:
m1
A proper approach might be to use crossed random effects in lmer. That way, you can have different sampling locations in different years.
Your nlme model is wrong, as you enter "season" both as a fixed and as a (top-level) random effect. Hence the fixed effect cannot be uniquely estimated.
Sir,
1) Is the formula given below correct:
m1
Where can we get the data? is there any further video?
Dear Sir, Greetings. I am Rabiul from Bangladesh. I am doing my PhD, I have done my analysis on the basis of your video. I have 2 treatments (open and bagged pollination) and I have 4 sites as replication (edge and centre) and 4 locations. I need the value of (df, f, and p) of seeds/pods, 1000 seed weight and plant yield. But I am not able to understand it. Would you please help me. Kind regards, Rabiul
Hey Christoph, is there any hope for a next video?
Sir when you will make a new video?
how is your matrix?
Hey Christoph,
Thanks for such a nice video! I have one question. Will you please help me with it!?
I am working on a field project where I am evaluating different fertilizer sources (4) applied at 3 different rates! I designed my experiment as a split-plot design with fertilizer source being my main plot factor and rate being as my sub-plot factor. I wanted to see if there is an effect of fertilizer source, rate, and fertilizersource*rate on plant yield. I created my model but I am not sure if it right. Plus I wanted to see if there is any difference between the blocks (total 4) with fertilizer source and rate.
Can anyone please help me!?
Here is my code for Anova and TukeyHSD:
CISER3
the model looks good. I´d use the Anova() function in John Fox´s "car" library (and maybe also the effects package) to inspect the model more closely
What hell do you do next? How come nobody ever tells you how to interpret the models?
What is this "R" thing please?
The software can be downloaded at www.r-project.org
Dear Sir, Please give the another type of data set