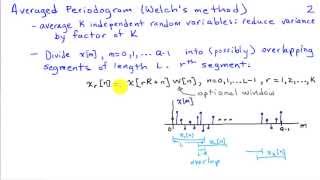
Introduces the periodogram approach to estimating the power spectrum of a time series, including characterization of the bias and variance of the periodogram.
Thank you so much for the explanation at 12:52 ! You saved my thesis. In my opinion is the matlab help in this case so bad and the literatur isn't very helpful.
I don't understand at 9:50 how come k goes from 0 to 1024 and L is only 64 points? Aren't we just using more fft points? k from 0 to L-1? zero padding?
Can anyone tell me if this method will help convert a non-stationary time domain signal into a stationary signal in the frequency domain? If not, could you suggest methods to go about doing so if you know? Thanks!
I am not an expert in this domain. But here is my understanding from what I have read. The processes generating the signals are random . Stationarity is characteristic of the process. A non-stationary process cannot be converted to stationary. One way to deal with them is to assume it to be piecewise stationary i.e. consider the signal to be generated by a stationary process over a small region in time. There may be other methods to deal with them (I don't know). Request any experts to weigh in and correct me if I'm wrong.
P. Zhao - You can't look at infinite signals digitally. So, in truth, if you're looking at a finite signal, it is already 'windowed'. If you truncate it, it is the same as saying you had windowed it with a rectangular window.


Thank you so much for the explanation at 12:52 ! You saved my thesis.
In my opinion is the matlab help in this case so bad and the literatur isn't very helpful.
Great. Thank you. But I didn't understand how you calculated True periodogram in the 4th slide.
I don't understand at 9:50 how come k goes from 0 to 1024 and L is only 64 points? Aren't we just using more fft points? k from 0 to L-1? zero padding?
excellent explanation..... about periodogram
i want know about significant of power spectral density (psd) ..i used 98% for my lomb-scargle in IDL
hi , how do i calculated the discrete espected value of the espectral density ?
what is the matlab code of periodogram
Possibly, I'm not sure exactly what you mean by mfcc calculations. Can you spell out that acronym?
Can anyone tell me if this method will help convert a non-stationary time domain signal into a stationary signal in the frequency domain? If not, could you suggest methods to go about doing so if you know? Thanks!
I am not an expert in this domain. But here is my understanding from what I have read. The processes generating the signals are random . Stationarity is characteristic of the process. A non-stationary process cannot be converted to stationary. One way to deal with them is to assume it to be piecewise stationary i.e. consider the signal to be generated by a stationary process over a small region in time. There may be other methods to deal with them (I don't know). Request any experts to weigh in and correct me if I'm wrong.
mel-frequency cepstral coefficients
Why would i window the signal ? Can't i compute the DFT of the whole signal ?
P. Zhao - You can't look at infinite signals digitally. So, in truth, if you're looking at a finite signal, it is already 'windowed'. If you truncate it, it is the same as saying you had windowed it with a rectangular window.
because only in that way can you know the short time characteristic of the signal,especially when signal is nonstationary
can you some videos related to mfcc calculations...
The Periodogram for Power Spectrum Estimation