Go to nordvpn.com/mathemaniac to get the two year plan with an exclusive deal PLUS 4 months free. It’s risk free with NordVPN’s 30 day money back guarantee! Please sign up because it really helps the channel! [My pinned comment gets removed by RUclips AGAIN!!!]
@@andsalomoni That doesn't work! Any three elements of a functional basis are independent. That's why when you are making a maximum likelyhood estimate you are assuming a distribution also.
This is insane. The demonstration with the points in 3d and 2d space not only made it clear why it works, but also made it clear why it doesnt work as well in 2d. Going from the paradox being magic to somewhat understandable is beautiful. I loved this video.
Also when I use mse and lme with the ordinary estimator I PCA the n dimensions into 2D so that this situation never arises and mse is effective and dominates. Instead of PCA, lda, svm also works. If no PCA go RMS prop + momentum, Adam does well/dominates
@@mrbutish I hoped for a similar moment but the accent really hurt my brain. couldnt concentrate on anything but the pronounciation of estematourr. Darn my brain.
For a layman, I think the worry after first seeing this explained (given the *very* fast hand waving with the errors at the beginning) is that you might suddenly be able to estimate something better by adding your own random data to the question, which by definition, makes the three data points not independent. The thing is, and I'm surprised you never clarified this, we aren't talking about a better estimation for any given distribution. We're talking about the best estimator for *all three* distributions as a collective. We're no longer asking 3 questions about 3 independent data sets, but 1 question about 1 data set containing 3 independent series. There is no paradox here, because it is pure numbers gamesmanship and is no longer the intuitive problem we asked at the beginning. When we went to multiple data sets, the phrasing of the question is the same, but the semantic meaning changes.
That is a good summary. One should not geometrize independent variables. A similar "paradox" occurs in uncertainties for complex numbers, so even the 2D case. If you Monte Carlo sample the modulus of a random z ϵ ℂ with 2D Z-dist centered at 0 + 0i the average |z| is something like a random walk distance, sqrt(N). But if you sample real and imaginary parts, average them, then compute the mean z then take |·| of that , it'll converge to zero as N → ∞. The average |z| ∼ sqrt(N), but the average z = 0 + 0i.
I think the only thing that might need clarifying is the definition of "better". Still though, I think the video made it clear that this estimator won't be better on average for the individual collections, but rather for this new cost function which adds the individual costs collectively. You're right however that it gets hard to phrase it as three independent questions, because they would be like: "Find the estimator f(x1, x2, x3) that minimizes the cost", when said "cost" would also involves the other collections.
if you include an own random set to get beyond 2 dimensions, then those fake data with their influence on the mean error will take over, so that there is no meaningfull conclusion on the original sets. on the other hand is you just duplicate a set 3times to go from 1d to 3d then you didn't introduce other data and still get another mean while the original mean is proven to be the best?
@@xyzbesixdouze But duplicating the set wouldn't generate a new independent set, would it? There would be correlation. This changes the distribution completely (won't be circles/spheres/etc. around the mean point), meaning that the justification for the James-Stein estimator won't work.
Lesson: One should not geometrize independent variables. A similar "paradox" occurs in uncertainties for complex numbers, so even the 2D case. If you Monte Carlo sample the modulus of a random z ϵ ℂ with 2D Z-dist centred at 0 + 0i the average |z| is something like sqrt(π)/2 (Rayleigh distribution). But if you sample real and imaginary parts, average them, then compute the mean z then take |·| of that , it'll converge to zero as N → ∞. The average |z| ∼ sqrt(π)/2, but the average z = 0 + 0i.
they don't feel the same tbh, i think a more similar comparison would be to compute the average distance traveled in the real and imaginary component and then add them up
This is very good. The only notes I have for how it might be improved are: 1. Make it clearer that when we have the 3 data points early in the video, we know from which distribution each of them comes, rather than just having 3 numbers. So, we know that we have say 3 generated from X_1, 9 generated from X_2 and 4 generated from X_3 rather than knowing that there's X_1, X_2 and X_3 and each generated a number and the set of the numbers that were generated is 3, 9, 4 but have no idea which comes from which. It can be sort of inferred from them ending up in a vector, but still. 2. "Near end" vs "far end", the near end being finite vs far end being infinite is a bit ehh as a point. It invites the thought of "well who cares how big the effect is in the finite area or how small it is in the infinitely large area, there will be more total shift in the latter anyway - it's infinite after all!". What matters is the probability mass for each of those areas (and it's distribution and what happens to it), and that's finite either way. Other than that, excellent video. Nice and clear for some relatively high level concepts.
The bias-variance decomposition is Part of my PhD thesis and i just gotta say your visualizations and explanations are very clean and intuitive. Good job!
I am glad it is still of relevance. It was one key element of my Doctorate dissertation 30 years ago even if I did not fully understood the relevance at that point. Best wishes fro your career if you are young and thank you for sharing.
Another great real life visualization of the concept is the following: Imagine two people playing darts. One of them hits all parts of the dartboard more or less symmetrically. They are on average in the middle, but each individual arrow might land oclose to the edges of the board. This is low or even zero bias but high variance. The other player's arrows always land very close to each other, but they don't center around The bullseye. The person is very focused and consistent, but can't get around the systematic missjudgement of the bulleye's position. Still, If they are close enought, they might win the majority of matches.
I am not a PhD. I would divide 7408 by 3. Then I would take 2469333…. And the square root is very close to pi. If you times it by two. That’s why the denominator I will do best with the largest no. You are not avoiding crystals.
The fact that I'm not particularly interested in statistics and also on my only 3 weeks of holidays from my maths-centric studies, yet I still was really excited to watch this video speaks for its quality. Thank you again for the amazing free content you provide to everyone!!
I have to admit that as someone not very familiar with statistics I was starting to get lost until you got to the 2D vs 3D visualization and I immediately grasped what was going on. That was an excellent way to explain it, and reminded me a lot of 3blue1brown's visual maths videos.
It is pretty awesome that you covering one of the most counterintuitive examples in statistics. This example motivates many exciting ideas in modern statistics like empirical Bayes. Keep up the good work.
Originally Stein's paradox was just a bit of a footnote in my class in statistics, but when I dived a little bit deeper into it, it is actually a much bigger deal than I first thought, so I decided to share it here!
@@mathemaniac Yup, it is. Maybe next time, you can cover something from stein as well, like stein's identity, which is a pretty powerful tool for proving the central limit theorem and its generalisations. Sadly, there aren't many videos explaining it to a wider audience except to other graduate students.
I’m a layman but this doesn’t seem counterintuitive because the distributions are the same. So what if they’re unrelated … they share the same reality. Are you surprised that mass is measured the same way for a rock or water? It’s simply recursive…the more data sets you have the more likely one of the points will be to center. It’s a weighted distribution of a normal distribution.
@@randyzeitman1354 I am not entirely what you mean by "sharing the same reality" and the "weighted distribution of a normal distribution". However, this estimator would work when x_1, x_2, x_3 come from different datasets for example, X_1 can be from a dataset for the height of building, X_2 can be from a dataset for the average lifetime of a fly and X_3 can be from a dataset of the number of times a cat meows. If we want to find the average of each of these datasets, it turns out it is better to use the James stein estimator then if we were to take the average of each of these things. That is what makes it counterintuitive for me. I would like to hear your intuition though,
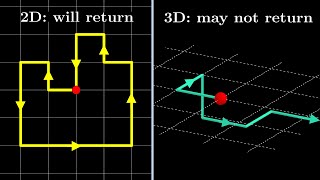
Does this paradox have any connection to the fact that random walk in 1 or 2 dimensions almost always returns, while in 3 and more dimensions it has a finite probability that it may never return? Proof for this uses normal distribution but I may be terribly wrong lol
Have you seen my idea list? (I mean I did post it on Patreon) Yes, there is a connection! But the next video is just about the random walk itself (without using normal distribution / central limit theorem), because the connection is explored in a very involved paper by Brown: projecteuclid.org/journals/annals-of-mathematical-statistics/volume-42/issue-3/Admissible-Estimators-Recurrent-Diffusions-and-Insoluble-Boundary-Value-Problems/10.1214/aoms/1177693318.full
@@leif1075 As someone with ADHD, I know very well how long and tedious lectures can make focusing literally impossible. Thus, I've given myself the liberty to give you a tip: try doing most of your research using resources that actually make the subject seem interesting to you. There surely are books that can teach even advanced college-level Statistics in simultaneously accessible and rigorous ways.
I think shrinkage isn’t widely discussed is because choosing MSE as a metric for goodness of parameter estimation is an arbitrary choice. It makes sense that introducing this metric would couple the individual estimations together, so it’s not really a paradox (in hindsight). In some sense, you want to see how well the model works, not how accurate the parameters are, since a model is usually too simplistic. But I do see this used in econometrics. I think I’m seeing more L1 norm used in deep learning as the regularizer, wonder what form of shrinkage factor that will have?
I was wondering the same thing. The paradox seems to arise from the fact that our error is calculated using an L2 metric, but the two coordinates are being treated independently. Aside from wondering how using an L1 norm would affect this, I was also thinking that rather than using two independent normal distributions whether this paradox would still exist if we used a 2-dimensional gaussian distribution. Because in this case, all points with the same distance from the center would now all have the same probability, which wouldn't be true using two independent normal distributions.
The relevance of "mean square error" here can be considered in the context of the probability distribution of the error. Here "error" means total squared error as in the video. Applying the shrinkage moves part of range of errors towards zero, while moving a small part of the range away from zero. The "mean squared error" measure doesn't care enough about the few possibly extremely large errors resulting from being moved away from zero to counterbalance the apparent benefit from moving some errors towards zero, But any other measure of goodness of estimation has the same problem. There are approaches to ranking estimation methods (other ways of defining "dominance") that are based on the whole of the probability distribution of errors not just a summary statistic. This is similar to the idea if "uniformly most powerful" for significance tests. The practical worry here is that a revised estimation formula can occasionally produce extremely poor estimates, as is illustrated in the slides in this video.
Statistics seems to shun elegance for practicality more than most branches of mathematics. The ordinary estimator is clean and intuitive while the James-Stein one is like a machine held together by duct tape, yet the latter works better in many cases.
I feel like you might be missing out on something if the James-Stein Estimator doesn't seem elegant by the end of this video. I would say this formula is more transparent in terms of what it does and why it works than most of the stuff we memorize in algebra. It is entirely possible I'm the weird one for looking at this and thinking "yeah, that looks like the right way." Different brains understand things in different ways.
No, the James-Stein estimator is biased and practically useless. Note that it doesn't matter which point you shrink towards, it will lower the error. That by itself should tell you how ridiculous this is. What we are truly looking for is the minimum-variance unbaised estimator. That is the definition of the "best" estimator. All this video shows is that MSE is insufficient to determine the best estimator. There are biased estimators with less MSE than unbiased ones.
@@KirbyCakeLoL Really reminded me of Goodhart's law here " When a measure becomes a target, it ceases to be a good measure." James Steins estimator chase the target of being "best" estimator which resulted in the failure of this "best" estimator.
@@KirbyCakeLoL Of course the James-Stein estimator is very rough and rudimentary, but the point of the video is how it served as inspiration for the idea of Bias-Variable tradeoff. So back to the point of elegance vs practicality. Minimum-variance unbiased estimator might be what you are "looking" for, but in reality that is just a conceptual dream. Bias-Variable tradeoff and how it's widely used in real world machine learning applications for regularization is the practical part that can't be dismissed and already applied everywhere.
I'm not all that familiar with advanced statistics, but I was pretty blown away by this paradox when you first presented it! However, once you started explaining how we normally throw out outliers in any case, It began to make a lot more sense. Good video!
All this paradox comes from trying to minimize the squared errors. The squared errors are used mostly because its easy to compute for most of classical statistics law and it fit prety well with most minimization algorithms. But in real world,in many cases, one will be more interested of the average absolute errors instead of squared errors. I think the "paradox" is there, we are using a arbitrary metric, and we never question it. When I used to be a quantitative analyst I often used the abs value instead of squared for error minimization, I found the result way more relevant despite some slight difficulty to run some algorithms.
such a cool video, I am a Machine Learning engineer and use regularisation techniques like shrinkage daily yet I didn't know it's origins were rooted in a paradox!
Never did anything like "shrinkage", and didn't get how all of this connects with machine learning. Until 45 seconds before the end, when suddenly all the pieces connected and I realized that I had been using shrinkage. And that the five-dimensional data in the database (which gets aggregated into four-dimensional data, which is then fed into the ML algorithm as a two-dimensial field) actually consists of 50,000-dimensional vectors. Ah, yes, the happy blissfully unaware life of an engineer! Anecdotal evidence: A group of engineers and a group of mathematicians meet in a a train, both travelling to a congress. The engineers are surprised to learn that the mathematicians only bought one ticket for the whole group of mathematicians, but the mathematicians won't explain. Suddenly, one mathematicians yells "conductor!". All mathematicians run to the toilet and cram themselves into the tiny room before locking the door. The conductor appears, checks the tickets of the engineers and then goes to the toilet, knocks at the door and says "ticket, please!". The mathematicians slide their single under the door to the conductor, and the conductor leaves, satisfied. When the mathematicians return to the group of engineers, the engineers complement the mathematicians on their method and say that they will use it themselves on the return trip. On the return trip, the engineers arrive with their single ticket, but are surprised to learn that the mathematicians had bought no ticket at all this time. Suddenly, one mathematicians yells "conductor!". All engineers run to the toilet and cram themselves into the tiny room before locking the door. One mathematician walks to the toilet, knocks at the door and says "ticket, please!". TL;DR version: the engineers use the methods of the mathematicians, but they don't understand them.
@@klausstock8020 Good story! I had thought the mathematicians would cram into the same bathroom with the engineers, but the actual ending was even more brilliant!
This is a great explanation of estimators and non-intuitive relations. I like that you highlighted its importance in machine learning. It would be worth doing another video about how the variance/bias relation and subsequent weightings adjustments affect those models, especially in the context of overfitting.
What a great video! For me you perfectly hit the pace. I was never bored but still didn't need to rewatch sections, because they were too fast. This is one of those beautiful paradoxes which you can't beleive, if you haven't seen the explanation.
The paradox stopped feeling paradoxically to me as soon as i realised that it all comes from adding all the errors together with equal weights. That already assumes that the estimated values are all on the same scale, are worth the same. There is not a lot more steps from there to assuming all the samples estimate the same value. We could for example have had one estimated value being in the magnitude of 10^24 and the other around 10^-24 and one would clearly decide against just adding the estimation errors together like one does here.
The variance from the mean is the same for all (1). So even if one mean is 10^24, the samples you collect will most likely be within +/- 1. And similarly the 10^-24 guy will still give you samples in 10^-24 +/- 1
The reason the Stein guy performs better is that the error is sum of 3 things. And there is a way to adjust your "estimator" so that it isn't the best for any one of the 3 variables, but the total is still less.
@@vishesh0512 oh yeah you're right, i forgot the fact that the variance of each is 1. Thank you, your explanation is better. That does make the JS estimator pretty powerful though. Evem though one could think of other ways of combining the errors other than summing, summing seems to be the very obvious choice.
Yes. The OP kept saying “completely independent distributions,” but that is an inaccurate description of the problem. A vector in n-dims is a single object, not the same as n separate distributions on n axes. The latter has nothing to do with Stein’s paradox, and actually the way this video begins is incorrect and does have an answer of the naive estimates as presented.
In fact, one can even read on Wikipedia: “In practical terms, if the combined error is in fact of interest, then a combined estimator should be used, even if the underlying parameters are independent. If one is instead interested in estimating an individual parameter, then using a combined estimator does not help and is in fact worse.” For a 21+ min video, you would think the author would at least spend the effort to accurately present the problem at the beginning.
this was really good, thank you! I used to work in a machine learning/DSP shop and did a lot of reading about estimators but I'm not sure I ever fully understood until I saw this video.
I found it a bit funny how recently statistics has become interesting (again), by referring to machine learning. But hands down: Great concept of two channels for "the engineer version" as well as the full details and your general style of teaching. Very understandable, good to grasp and intriguing. Subbed
It was always interesting to us scientists and people who are interested in making empirical deductions. Transformer models aren't the only reason to be interested in statistics.
Idk what I expected by watching it or why I watched it having a nonexistent education of statistics. At least now I know that I don't understand yet another semi-complicated concept in this universe. Judging by the comments you did a decent job of explaining and visualizing this topic. Keep up with the good effort!
To my physics-trained eyes, the formula at 3:00 looks incorrect or at least incomplete for general variables having units. Are all _x_ components expected to be dimensionless and normalized to σ_i = 1? But where would one get the σ_i from?
I believe all that's required is the inputs are dimensionless, so you can do the naïve thing and divide by the unit or be more precise by using some physical scale for that dimension if it's known.
Aha, on Wikipedia the James-Stein estimator is shown with σ² in the numerator, which would indeed take care of units and scale. Alas, this makes the estimator _dramatically less useful_ in real-world situations because it can only be applied if σ² is known _a priori_ .
I was thinking the same thing. If you wanted to define a shrinkage factor that works for data sets with variances that aren't normalized to 1, you'd need to explicitly write that into the equation. I.e. every time there's an x_i in the shrinkage factor, you'd replace it with x_i/sigma_i. One consequence is that the James Stein estimator can only be used if you know (or have an estimate for) the variance. And if you have only an estimate for the variance (which is the best you can hope for if you don't know the true distribution already), then that can deteriorate the quality of the estimator.
No, that's not true. Also on Wikipedia, you can apply the James-Stein estimator if the variance is unknown - you just replace it with the standard estimator of variance.
@@sternmg the JS phenomenon was only ever meant to be a counter-example of sorts, not applied statistics -- that's why they didn't bother defining an obvious improvement that dominates the JS estimator (to wit, the "positive-part JS estimator" that sets the estimate to zero when the shrinkage factor goes negative). If you want practical shrinkage methods use penalized maximum likelihood with L1 ("lasso") or L2 ("ridge") penalties (or both, "elastic net") or Bayes.
Really great video, incredibly paced. The question that occurred to me is: Are we just abusing the definition of mean square error passed it's useful/intended use? Are we sure that lowering it is ALWAYS desirable?
@@jsupim1 This is a really naive thought that, sadly, pervades much of even professional science. While I can see your thinking on this in the context of a "broad-use" estimator like James-Stein--I disagree, but I see it--this thought simply falls apart when applied to a more nuanced scenario. Imagine a situation where you want to use relatively little data to infer something about a highly complex system. Say, data from an MRI to infer something about brain vasculature. There are dozens upon dozens of parameters that might affect even the simplest model of blood flow in the brain: vessel size distributions, arterial/venous blood pressure, blood viscosity, body temperature, and mental and physical activity levels. If you leave all of those as fitted, unbiased parameters, you do not have enough information to solve the inverse problem and retrieve your answer. (For the sake of argument, let's say average vessel size is what you're interested in.) So the unbiased estimator totally fails, as the mse is many times larger than the parameters. Now open up the idea of parametric constraint, a special case of the broader "regularization" described in this video. Let's say you measure blood pressure before someone enters the scanner, use 37C for temperature, go to literature to find the average blood viscosity, and assume all vessels are one unknown size in a small region. None of these will be _exactly accurate_ to the patient during the scan. What you've done is created a biased estimator that might just be able to work out the one thing you're interested in: average vessel size. Unless your guesses are very, very wrong, it will almost certainly have a lower vessel size mse than the unbiased estimator.
Thank you, this is exactly how I feel. As soon as MSE leads us to use information from non-correlated, independent distributions to make deductions on the one under focus means MSE is wrong. That needs to be an axiom of statistics or something. Valid Error systems cannot have dominant approximators that use info from outside, non correlated systems.
@@phatrickmoore I think your intuition leads you astray, just consider genetic algorithms for optimization problems. These can often outperform any deterministic approach, even though they use stochasticity (hence random variables drawn from distributions that are independent from the optimization problem).
I haven't thought about this in detail at all, but is this counterintuitive result dependent on the use of the mean squared error? Would it be avoided if one used eg the mean absolute error instead? (If so, doesn't it amount to a reductio ad absurdum refutation of the use of mean squared error?)
It happens because MSE treats errors in each parameter as comparable. If you think about actually estimating quantities of interest you'll see that the MSE as expressed here isn't dimensionally consistent: there's an implicit conversion factor that says that whatever the variance in the individual components is, that sets the scale for how errors in different components are traded off against one another. It's the way this trading off of errors in the different components works that leads to the the shrinkage estimator dominating the maximum likelihood estimator. I haven't checked but using mean absolute error would require an the same trading off of estimation errors so I'd expect to have a James-Stein-style result with that loss function too.
@@coreyyanofsky If you had some data set where errors in dimensions aren't comparable because, say, you weigh error twice as heavily in x_1 than in x_2, then you can just scale x_1 by a factor of two and try to estimate 2mu_1, and the paradox still happens. I suppose instead you may be completely unwilling to compare the dimensions, but then "best estimator" for the set is meaningless. This is strange.
@@terdragontra8900 If you change the weighting so that you're no longer variance 1 in some component then the loss function is weighted MSE and the sphere in the video becomes an ellipsoid; this will make the math more complicated for no real gain because the JS phenomenon was supposed to be a counter-example of sorts and not applied statistics.
I think they key insight is that, in higher dimensions, it's not like you're getting a better estimate *for each separate dimension* than you would've if you'd estimated each separately. But the, like, "length" of the error vector will be less. The problem might be how we ought to be interpreting that length.
Nice video! I have studied machine learning since 2014, I have heard the term "bias-variance tradeoff" multiple times and only now I understand. Thank you so much for the explanation.
This just blew my mind. I kept expecting to see some disclaimer come up that would relegate this paradox to purely an academic context. But dang, this concept is incredible!
A lot of people say that they find the Banach-Tarski theorem to be upsetting, but this result is so much worse than that. You can make the Banach-Tarski phenomenon go away with some pretty weak continuity assumptions, but this is a really strong result that applies in real-world situations and isn't going to go away no matter what you throw at it. In fact I suspect you can make some pretty sweeping generalizations of it. I think the main reason I find it so hard to accept is that I have a really strong intuitive sense that there should be a unique "best" estimator -- i.e., you shouldn't be able to get a better estimator by biasing it in an arbitrary direction, which is exactly what happens with the James-Stein estimator. I suspect that, based on similar reasoning to what's presented in this video, you can show that, in these kinds of situations, there can be no unique "best" estimator. (Edit: I originally had "admissible" where I now have "best", but I've since realized that's not really what I meant.)
The fact that this method treats the origin special should already be a red flag that something is off. The only thing that can be off is the way we measure how "good" an estimator is. There are several options that seem equally valid. Why do we take the square deviation? Why do we take the sum of the expected values? Why not the expected value of the Euklidean norm of the deviation? Or maybe we shouldn't take any squares at all?
It does not need to be the origin - you can equally shrink towards some other point (but pre-picked), James-Stein estimator still dominates the ordinary estimator. As to the mean squared error, I agree that this is somewhat arbitrary, but it is partly due to convenience - the calculations would be, normally, the easiest if we just take the squares; and without these calculations, we wouldn't be able to verify that James-Stein is indeed better. But if you adopt the view of Bayesian statistics, then mean squared error has a meaning there - by minimising it, you are taking the mean of the posterior distribution.
The relevance of "mean square error" here can be considered in the context of the probability distribution of the error. Applying the shrinkage moves part of range of errors towards zero, while moving a small part of the range away from zero. The "mean squared error" measure doesn't care enough about the few possibly extremely large errors resulting from being moved away from zero to counterbalance the apparent benefit from moving some errors towards zero, But any other measure of goodness of estimation has the same problem. There are approaches to ranking estimation methods (other ways of defining "dominance") that are based on the whole of the probability distribution of errors not just a summary statistic. The practical worry here is that a revised estimation formula can occasionally produce extremely poor estimates, as is illustrated in the slides in this video.
@@djtwo2 That's what the video itself says. But there is no explanation given for that awkward quality metric over several dimensions. It's just a sum over each dimension without any further justification. Honesty, I would expect a norm on the higher-dimensional space on the bottom of the formula, then taking expectation of the squares like in 1D. But that's not what's happening. I mean expectation value is a linear operator so it may boil down to the Euclidean norm.
What disturbs me on this method is that it is not scale invariant. Let's say we have three random measurements of distance, 1 m, 2 m, and 3 m. Then the estimates would be 0.92, 1.85, and 2.78. But if we express the same measurements in feet, calculate the estimates and then convert them back to meters, they will be 0.99, 1.98, and 2.98. That does not sound right. Or did I miss something?
The MSE as expressed in the video is dimensionally inconsistent for measurements with units. Implicitly the variance is setting the scale here -- you measure in units such that the standard deviation is 1, and this scaling eats the units.
The estimator requires that all component quantities be normalized, i.e., to be dimensionless and have variance 1. This means real-world input components must all be scaled as x_i := x_i/σ_i, which means that all component _variances must be known beforehand_ . That is not exactly practical and also makes the estimator less miraculous.
You can use the usual estimate for the variances (if you have more data points, in which case, the means still follow normal distribution, just with different variances), and the James-Stein estimator still dominate the ordinary estimate, so you don't have to know the variances actually.
10:39 i mean nowdays if you're doing anything at all sensitive on a non-https website you're making a big mistake. 10:55 browser fingerprinting is a thing and can often uniquely identify a device. sure, a vpn makes it a bit harder, but unless you're hardening your browser (which anyone in the intended audience of this ad is not doing) it doesn't matter that much.
As a graduate student who has poured through countless math explanation youtube videos in the past years, this has to be one of the most beautiful! The writing, the story, the visuals, and the PACE --- all skillfully designed and executed. Definitely recommending this to my peers. Great fun to learn something new in this way. I appreciate your work greatly!
This could be wrong but I see an example to illustrate this in real life: Consider a box of screws of varying length. Now randomly pull a screw. The length of the screw will be the data point. The tolerance will be the mechanical variation in length. Let’s also add the requirement that the variation will be consistent across all screws, just as the variance is the same in the data point examples at the start. Intuitively and mathematically, then, more information about the actual value of the tolerance, which is unknown will be accumulated as more screws are examined. This information can be used to predict how close the actual “ideal” length of the screws compares to the observed length. You can then select “better” screws from what has been accumulated. The apparent independence of the samples (length) is an illusion because they share a common value of the variance or spread.
I don't think you did a very good job in the introduction of giving motivation for why it would even be possible to find a better estimator than our naive guess. As the video went on it made sense, but at the beginning when you were introducing the concept of multiple independent distributions, I wish you had included a line like "we are trying to find the best estimator overall for the system of three independent distributions, which may not be the same as the best estimator for each independent distribution".
Thanks for the feedback! I did initially want to include this into the script but eventually decided against it. This is because when I first read about Stein's paradox, and that it is because of reducing the overall error rather than individual errors, I just moved on, because I immediately felt the paradox is resolved. But when I read about James-Stein estimator again (because of the connection with the next video), I realised it was a much bigger deal than I thought it would be, like the idea of shrinkage and bias-variance tradeoff. In my opinion, this would be a much, much more important concept. In other words, if I said the line that you suggested, in the beginning of the video, my past self just would not continue to learn the much more important lessons later on in the video. So perhaps if given the second chance, I could have said it at the end of the video, but I would still not put this in the beginning.
@@mathemaniac Ah, but you must also know that burying the lead for tactical reasons is a very dangerous game. My formal math education predates Moses, but I think I still have good instincts, most of the time. In my own writing practice I often take wildly unconventional paths, to help break people out of established cognitive grooves. It's a useful posture, and sometimes it's not bad to inform the process from an introspective stance on _your own_ foibles and aversions. But you also have to be as honest as possible up front, and not go "hey, surprise, bias!" in the third act, when the gun was already smoking at the first rise of the curtain. Surely there's only one possible unbiased estimator for a symmetric distribution. You know, that first screen you introduced. Which way would you deviate? It's symmetric, you can't choose. Having but one unbiased estimator on the store shelf, if you have no bias tolerance, you are done, done, done in the first act. This was making me scream inside for the first ten minutes. And then if you go on to show that least squares estimation steers you into a biased estimator, what you _ought_ to conclude is that least squares (as applied here) is _totally inappropriate_ for use in regimes with zero bias tolerance. Which is an interesting result on its own terms. Furthermore, I had a lot of trouble with the starting point where you know the variance for certain, but you're scrabbling away with one data point to estimate the mean. Variance is the higher moment, which means we are operating in a moment inversion (like a temperature inversion over Los Archangeles), where our certitude in higher moments precedes our certitude in lower moments, which is pretty weird in real life. So I mentally filed this as follows: in an Escherian landscape where you know your higher order moments before your lower order moments (weird), then sometimes grabbing for least squares error estimation by knee-jerk habit will either A) lead you badly astray (zero bias tolerance); or B) lead you to a surprising glade in the promised land (you managed to pawn some bias tolerance for a dominating error estimator). I admire your thought process to take a motivated, pedagogical excursion. But failing to state that the naive estimator is the only possible unbiased estimator at first opportunity merely opened you up to a different scream from a different bridge. Because this whole thing was The Scream for me for the first ten minutes. So then your early segue is "but look at the surprising result you might obtain if you relax your knee-jerk fetish for zero bias" and _then_ I would have settled in to enjoy the ride, exactly as you steered it.
@@mathemaniac I had to get that first point out of my system, before I could gather my thoughts about the other aspect of this that was driving me nuts. It was pretty clear to me from early on that if your combined least squares estimator imposed a Euclidean metric, that you could win the battle on the kind of volumetric consideration we ended up with. I'm am _totally_ schooled on the volumetric paradox of high-dimensional spaces (e.g. all random pairs of points, on average, become equidistant in the limit; I usually visualize this as vertices of discrete hypercubes, with distance determined by bit vector difference counting - it's my view of continuous mathematics that has degraded greatly since the time of Moses). But then I had a minor additional scream: why should our combined estimator be allowed to impose a Euclidean metric on this problem space? When did this arranged marriage with Euclid first transpire, and why wasn't I notified? Did Gauss himself ever apply least squares with a Euclidean overlay informed by independent free parameters? It seems to me that if you just have many instances of the same thing with a _shared_ free parameter, and complete indifference about where your error falls, this amounts to an obvious heuristic, without much need for additional justification. But then when you have independent free parameters, the unexpected arrival of a Euclidean metric space needs to be thoroughly frisked at first contact, like Miracle Max, before entering Thunderdome, to possibly revive the losing contestant. Tina Turner: "True Love". You heard him? You could not ask for a more noble cause than that. Miracle Max: What's love got to do with it? But in any case that’s not what he said-he distinctly said “To blave”- Valerie: Liar! Liar! Liar! Miracle Max: And besides, my impetuous harridan, he was worked over by a chainsaw strung from a bungee cord, and now most of his body is scattered around like pink wedding confetti. Valerie: Ah, shucks.
@@mathemaniac Final comment, sorry for the many fragments. 1) you're willing to sell bias up the river (but only for a good price) 2) you're in an Escherian problem domain where a higher order moment is fixed in stone by some magic incantation (e.g. Excaliber) while a lower order moment is anybody's guess 3) you don't find it odd that your aggregated error function imposes a Euclidean metric space then 4) you arrive at this weird, counterintuitive, nay, positively _paradoxical_ result But, actually, for me, by the time I've swallowed all three numbered swords, any lingering whiff of paradox has left the building with all limbs normally attached.
@@afterthesmash Re: the variance point. If you use a lot of data points to estimate the mean for each distribution, then you will still be able to obtain an estimation of variance, and use that to construct the (modified) James-Stein estimator, and it will still dominate the ordinary estimator. More details on the Wikipedia page for James-Stein estimator.
I am wondering… If I had a single measurement to estimate in one dimension. Could I use a random number generator to create data sets in two more dimensions, then use the James Stien estimator to get a more accurate result? Basically shoehorn the estimator into a one dimensional problem?
Heh. Good thought, but nope: This is about the "best" overall guess for the whole set of variables with the same variance; there's no saying which mean you will have the biggest error guessing. If you think of the p-2 over the division line as your degrees of freedom, and you do the J-S equation for 4 numbers, then run a second number on each variable and remove the worst fit to get down to 3, chances are equal that it's the variable you wanted to shoehorn which gets tossed.
That's a really cool paradox, great video! Question about the "best estimator": Would this definition mean always guessing 7 is also an admissible estimator because no other estimator can have mean squared error = 0 in the case that the actual mean is 7?
Yes! I originally wanted to say this in the video but decided against it to make it a bit more concise. Indeed, your observation adds fire to the anger by those statisticians who really believed in Fisher - admissibility (what I called "best" estimator) is a weak criteria for estimators, but our ordinary estimate fails this!
@@mathemaniac around 14:30 you just mean a higher distance results I smaller shrinkage because since the denominator is getting larger, the entire term p Mina 2 over tbst distance will shrink since the numerator stays the same..that's all you meanr right?
@@leif1075 Yes - if the original distance is large, then the absolute reduction in distance will be small, because the original distance is in the denominator.
The main reason that this is counter-intuitive, IMHO, is that it does not have the obvious symmetry. Suppose we sample from [N(m1,s1), N(m2,s2), N(m3,a2)] and get [x1, x2, x3]. Suppose our estimator for [m1, m2, m3] is [m'1, m'2, m'3]. This might be [x1, x2, x3] or it might not. Now suppose we get [x1+t1, x2+t2, x3+t3]. Imagine the t1, t2, t3 as being very large. Surely our estimator should be [m'1+t1, m'2+t2, m'3+t3]. The problem has a symmetry, so surely our solution should exhibit the same symmetry. The James-Stein estimator does not have that property. But here's the thing. If a problem has a symmetry, then the set of all solutions must have the same symmetry, but unless the solution is unique no individual solution needs to have that symmetry. Spontaneous symmetry breaking and all that. So there are other James-Stein estimators which are given by taking the origin to be at [u1, u2, u3], and these also beat the [x1, x2, x3] estimator, and the set of all of them has the expected symmetry.
Yes - you can also shrink it towards any other arbitrary, but pre-picked point. You can even think of the ordinary estimate as just shrinking towards infinity.
Currently studying ML and went over Thompson Sampling recently . This is a great video as i immediately saw the similarities and was able to follow along even though i knew nothing about ML before i got started. Definitely subscribing .
The way hypervolumes have such dense neighbourhoods seems to be very interesting and useful in many places - I suspected it'd be involved as soon as you mentioned 'in 3 or more dimensions'. And that stems from a little personal experience I had. I was working on a quality optimisation computation in 32 dimensions a while ago and opted to use simulated annealing algorithm, on a hunch that stochastic algorithms would scale best in this higher number of dimension. I had to laugh when trying to figure out a sensible distance function (used to govern how far the sample picker would jump in an iteration). We had felt overwhelmed by the size of the sample space since the start, but I began to realise that all these trillions of coordinates were in fact within only a few nearest neighbours of each other.
I have a naive question about why this works: So given the original setup, you basically draw numbers (mu) in the range from [-infinity,+infinity]. If all numbers are equally likely, the expected value for this drawing should be zero? Then we get a second information, that is the single confirmed value that we know for each distribution. Given that the expected value of all mus should be zero, can we just assume that it is more likely that the actual mu is slightly closer to zero than the number we know? However if you shrink too much you will also lose out on accuracy. Therefore there could be an optimal "amount" of shrinkage? Does this make sense?
I think the expected error will always be the same no matter what the shrinkage factor is? A uniform distribution is basically a straight line, so it'll look the same no matter how you stretch or shrink it. The variance of the distributions is (infinity - infinity) / 2 = ...dammit. Ok let's draw numbers from the range [-x, x] instead. So now the variance of the distributions is (x - x) / 2 = 0, which approaches 0 as x approaches infinity. The shrinkage factor basically multiplies this variance, and 0 multiplied by anything is still 0. (Don't quote me on this, I don't know much about statistics, but this just made sense to me)
It reminds me of the Curse of Dimensionality. Some stuff works well in 2D but not in higher dimensions. It’s like the “sphere between 1-unit spheres packing a 2-unit cube”. If you draw a circle that touches the inside of 4 unit circles forming a square, it would have a radius of √2-1 ≈ 0.414 units; if you draw a sphere that touches the inside of 8 unit spheres forming a cube, it would have a radius of √3-1 ≈ 0.732 units. But for 4D and up, the center hypersphere is the same size as the corner hyperspheres (√4-1=1), and in 5D and above, the center hypersphere is bigger, and eventually becomes uncontainable in the hypercube.
Also, don't forget that the mean squared error is an arbitrary definition of error, used mostly because squaring something makes it positive without making a huge mess of the algebra. It arguably has nothing to do with intuition, it puts far more weight on large errors than our intuition might. I feel like my intuition is closer to mean-absolute than mean squared. Would the JS-estimator or anything else be better if we used mean-absolute error?
The intuitive explanation given in this video does not really have anything to do with the exact form of error that we consider. It might not be the JS estimator, but some other shrinkage estimator might dominate the ordinary estimator, e.g. www.jstor.org/stable/2670307#metadata_info_tab_contents But as you noted, the algebra is going to be messy, and it will be very difficult to obtain a definitive answer, just empirical evidence.
@@mathemaniac Thanks. I could be missing it (there's a lot in there I cannot parse) but it's a bit unclear to me what they have found there, it doesn't seem to claim that it dominates in LAD error. They say "Finally, using stock return data, we present some empirical evidence that the combination estimators have the potential to improve out-of-sample prediction in terms of both mean squared error and mean absolute error." which seems like a much weaker claim. Anyway, thanks for your video, it was very interesting and well presented. Just LS-error has always bugged me, it was chosen for convenience, we should expect unintuitive results sometimes.
Congratulations on reaching 100 K subscribers! I think this channel will continue to grow because the content is very high quality and there aren't many like this.
How does this result connect with Bayesian estimation? To me it seems to make sense that the reduction starts to happen at 3 sampled points because there is an implicit (within the MLE estimator) prior hyper-parameter distribution on the supposedly-independent distributions, namely that their (improper) prior means are uniform on the Real line. But once you have sampled from at least 3 of these distributions, you now have enough data from the hyper-prior distribution to outweigh the improper uniform prior of the individual distributions. Namely, the hyper-prior on the original 'independent' means should be updated to be somewhere close to the average of the three sample points. So, I imagine that if this whole scenario was rephrased in terms of a hierarchical Bayes model, with hyper-parameters for the means of the multiple distributions, you would not only get a better estimator than the naive MLE estimator, but you'd almost certainly eliminate the negativity flaw in the James-Stein estimator.
I'm a Bayesian and I don't think there's necessarily a connection here. This phenomenon happens because of the way the loss function trades off estimation error in the different components of the estimand. This particular loss function is not an essential piece of Bayesian machinery, and if you think about it, Bayes licenses you to shrink whenever the prior information justifies it even in 1 or 2 dimensions.
James-Stein estimator is also an example of an empirical Bayes estimator. You can derive it by considering the prior distribution as centred around the origin, but the variance-covariance matrix is estimated from the data itself.
My impression is that the reason shrinkage works is fundamentally because we have an additional bit of information a priori: Values closer to 0 are more likely than values further away. This becomes obvious with very large numbers. We know intuitively that any distribution we encounter in real life will be unlikely to have a mean above 2^50 lets say. This is important because for values far from zero, the James Stein Estimator loses its edge. If we didnt assume a bias towards 0 and would truly consider all possible values equally (eg a mean of 2^50^50 is just as likely as a mean between 0 and 1 million), we would see that the James Stein estimator is in fact not measurably better over all possible numbers (its average error approaches the same limit as the simple estimator). Its just better for numbers close to 0, which turns out to include any distribution we will ever encounter at least to some degree because nature is biased towards number closer to 0.
If you know a priori that your true value is actually very large, you can shrink towards that far away point instead! There is nothing special about 0.
If you consider all numbers, any finite positive number you pick, no matter how large, will still be small in the sense that there is an infinite range of larger numbers than your chosen number, but only a finite number of smaller positive numbers. So compared to all numbers, we cannot help but pick numbers close to 0! Knowing this, we can bias towards small numbers and improve. Any other number you might chose to shrink to is special too because in the same sense it is also a small number (it might be better than or worse than 0, but just like 0 it will help at least a little bit). If you "shrink" towards infinity, I think that will only help if you change the methodology a bit and shrink not based on the distance to infinity (that would get you just a constant additive shift to all values - that doesnt help) but based on the distance to a finite set point. So again, as you get further from the set point, the benefit of shrinking will decrease and approach 0. That being said I am confused as to why shrinkage doesnt work in 1d and 2d, so maybe I am mistaken.
As soon as you started talking about bias-variance tradeoff I started thinking about biased sampling in Monte Carlo methods (and in rendering in particular). Sometimes it's worth losing the eventual convergence guarantees of the unbiased estimators if it also kills the sampling noise that high variance introduces.
Go to nordvpn.com/mathemaniac to get the two year plan with an exclusive deal PLUS 4 months free. It’s risk free with NordVPN’s 30 day money back guarantee! It will also greatly help the channel, so do sign up!
I'm taking advanced econometrics this semester and this James-Stein approach came up as one of the example of shrinkage estimator. Felt like spotting an easter egg in a movie haha
It's just that people don't know the principles behind statistics, or just thought statistics is just the mean, mode, median stuff, when in reality, there is a huge theory on parametric inference.
Amazing video! But I have one nitpicky comment: at 15:00 your arrows are misleading, the shrinkage factor is actually the same for the bottom left arrow and for the "near end" arrow
Yes, but... the dominance result holds whichever point you shrink to, i.e. if you have pre-picked a point, then adding a shrinkage factor towards that point to form the James-Stein estimator would still dominate the ordinary estimate. You can think that the ordinary estimate is "shrinking" the sample towards infinity if you will.
@@falquicao8331 Yes, if you know the variances in advance you can modify the estimator by dividing by the coordinates variance somewhere. But the estimator does not work if it is not known in advance (which is typical in a practical setting)
It still works if the variance is not known in advance. You just have to modify the variance to be the standard estimator for variance. The dominance result still holds.
What you failed to make clear, is that an estimator for 3 variables is completely different from 3 estimators for 1 variable each. So, what the James-Stein estimator is doing, is basically making some of the estimates worse, and some better. Such that the total sum of error across all of them is less, but the actual estimate for each one on their own is likely worse.
"An estimator for 3 variables is completely different from 3 estimators for 1 variable each" - maybe the perspective might be different, these two situations are completely the same mathematically, essentially depending on whether you call the vector and its components "completely" different. (Maybe I interpreted your statement wrong, though) But I do agree that James-Stein estimator makes some of the estimates worse and some better, but overall better. However, this is very difficult to illustrate, and I just aim to explain the advantage of shrinkage instead, because that is the much more important message applicable to modern statistics / machine learning.
@@mathemaniac They aren't the same though. Because the James-Stein estimator performs worse on some estimates, a singular such estimator will be outperformed by some mix of the naive and James-Stein estimators.
The estimators themselves are the same - it is just the components of a vector, but *how we measure its performance** are different. In one case, we measure it using the overall error; in another, we use just one singular error.
0:28 "Suppose I have a set of data that follows a normal distribution with some unknown mean mu and a variance of 1" What is the distribution of possible mu values?
Think of it as "I know what mu is, but I just don't tell you". To be honest, this is more of a frequentist view than the Bayes view you said in your comment.
It would be cool if the terms used in this video were explained a bit. Up until 13:00 I thought that mu is meant to be value at maximum, not the point at which maximum occurs, which was pretty confusing
For some very important statistical applications though, we would never adopt a biased estimator for a more precise one, for example where we want to make a causal inference
In 1982 I contacted Dr Ephron at Stanford University and on his help used the JS estimates for stands of bottom land forest in Arkansas, Louisiana and? Mississippi. These stands were residual acres of valuable cypress and oaks?
Are we trying to find the best estimator for all the datasets? For the estimate of µ1 (2:54), you say it's better to include the points from other datasets. Why would the existence of unrelated data change anything about µ1?
@@mathemaniac in that case, isn't it just that some sort of centroid of the 3 estimators would be best for reducing overall error? (that doesnt seem like a paradox anymore)
Ooh I use a lot of smoothing/shrinkage stats models and have seen the JS estimator a few times mentioned in my reference books. Excited to see cool video about it.
The original baseball example (that you link to in the description) is still really good. The players’ batting averages are independent and a player’s past performance should be the best predictor of their future performance but the shrinkage smooths some noise out.
11:57 To anyone who were struck like me by the fact that JS may work better even when the shrinkage factor makes its components negative, and so even if you knew for physical reasons that the actual means can't be negative: the thing is that the SD were standardized to 1, so you will basically never sample really small numbers if you assume that 99.9% of the data are positive, making the actual means larger than 3 or 4 in the standardized scale.
I am really not sure what you mean by "never really sample really small numbers", because you definitely can sample really small numbers under the SD assumption.
@@mathemaniac Sure, the Gaussian function never vanishes, but it does become incredibly small quite fast. If you want to implement the assumption that "(basically) all observations are positive", together with the assumption that SD=1, it makes the event of the shrinking factor being negative very unlikely.
3:13 the way you phrased this makes it sound like i can better estimate whether my crush likes me if i also take under consideration the alignment of the planets on the day of her birth and how much wood a given woodchuck chucked, given that a woodchuck would chuck wood
Since the problem seems to me invariant by change of origin, one could also pull the estimated point towards another point than (0,0,0)? What would be the formula in this case? Should we replace the naive estimate by λ*naive_estimate+(1-λ)*shrinkage_target ; with λ being the shrinkage coefficient : (1 - 1/||naive_estimate - shrinkage_target||²)?
@7:24 whta's an "ordinary estimator"? what's a naive guess? why is "naive guess (7)" in blue, when it's in pink @6:33? what is the y axis in this plot?


Go to nordvpn.com/mathemaniac to get the two year plan with an exclusive deal PLUS 4 months free. It’s risk free with NordVPN’s 30 day money back guarantee!
Please sign up because it really helps the channel!
[My pinned comment gets removed by RUclips AGAIN!!!]
bc everything is related, eventually. in the oneness of God. right? _JC
This paradox should mean that you can't have 3 or more independent distributions. The maximum is 2.
there is better estimator when do furier transformation and go single dimenaion on system
@@andsalomoni That doesn't work! Any three elements of a functional basis are independent. That's why when you are making a maximum likelyhood estimate you are assuming a distribution also.
This is insane. The demonstration with the points in 3d and 2d space not only made it clear why it works, but also made it clear why it doesnt work as well in 2d. Going from the paradox being magic to somewhat understandable is beautiful. I loved this video.
Thanks for the kind words!
Also when I use mse and lme with the ordinary estimator I PCA the n dimensions into 2D so that this situation never arises and mse is effective and dominates. Instead of PCA, lda, svm also works. If no PCA go RMS prop + momentum, Adam does well/dominates
@@mrbutish I hoped for a similar moment but the accent really hurt my brain. couldnt concentrate on anything but the pronounciation of estematourr.
Darn my brain.
@@arnoldsander4600not even a strong accent
@@arnoldsander4600i like the way he says "sure". 😊
For a layman, I think the worry after first seeing this explained (given the *very* fast hand waving with the errors at the beginning) is that you might suddenly be able to estimate something better by adding your own random data to the question, which by definition, makes the three data points not independent. The thing is, and I'm surprised you never clarified this, we aren't talking about a better estimation for any given distribution. We're talking about the best estimator for *all three* distributions as a collective. We're no longer asking 3 questions about 3 independent data sets, but 1 question about 1 data set containing 3 independent series. There is no paradox here, because it is pure numbers gamesmanship and is no longer the intuitive problem we asked at the beginning.
When we went to multiple data sets, the phrasing of the question is the same, but the semantic meaning changes.
That is a good summary. One should not geometrize independent variables. A similar "paradox" occurs in uncertainties for complex numbers, so even the 2D case. If you Monte Carlo sample the modulus of a random z ϵ ℂ with 2D Z-dist centered at 0 + 0i the average |z| is something like a random walk distance, sqrt(N). But if you sample real and imaginary parts, average them, then compute the mean z then take |·| of that , it'll converge to zero as N → ∞. The average |z| ∼ sqrt(N), but the average z = 0 + 0i.
Well put - I think this would have deserved at least a sentence or two in the video.
I think the only thing that might need clarifying is the definition of "better". Still though, I think the video made it clear that this estimator won't be better on average for the individual collections, but rather for this new cost function which adds the individual costs collectively. You're right however that it gets hard to phrase it as three independent questions, because they would be like: "Find the estimator f(x1, x2, x3) that minimizes the cost", when said "cost" would also involves the other collections.
if you include an own random set to get beyond 2 dimensions, then those fake data with their influence on the mean error will take over, so that there is no meaningfull conclusion on the original sets. on the other hand is you just duplicate a set 3times to go from 1d to 3d then you didn't introduce other data and still get another mean while the original mean is proven to be the best?
@@xyzbesixdouze But duplicating the set wouldn't generate a new independent set, would it? There would be correlation. This changes the distribution completely (won't be circles/spheres/etc. around the mean point), meaning that the justification for the James-Stein estimator won't work.
Lesson: One should not geometrize independent variables. A similar "paradox" occurs in uncertainties for complex numbers, so even the 2D case. If you Monte Carlo sample the modulus of a random z ϵ ℂ with 2D Z-dist centred at 0 + 0i the average |z| is something like sqrt(π)/2 (Rayleigh distribution). But if you sample real and imaginary parts, average them, then compute the mean z then take |·| of that , it'll converge to zero as N → ∞. The average |z| ∼ sqrt(π)/2, but the average z = 0 + 0i.
What is this “paradox” called?
they don't feel the same tbh, i think a more similar comparison would be to compute the average distance traveled in the real and imaginary component and then add them up
This is very good. The only notes I have for how it might be improved are:
1. Make it clearer that when we have the 3 data points early in the video, we know from which distribution each of them comes, rather than just having 3 numbers. So, we know that we have say 3 generated from X_1, 9 generated from X_2 and 4 generated from X_3 rather than knowing that there's X_1, X_2 and X_3 and each generated a number and the set of the numbers that were generated is 3, 9, 4 but have no idea which comes from which. It can be sort of inferred from them ending up in a vector, but still.
2. "Near end" vs "far end", the near end being finite vs far end being infinite is a bit ehh as a point. It invites the thought of "well who cares how big the effect is in the finite area or how small it is in the infinitely large area, there will be more total shift in the latter anyway - it's infinite after all!". What matters is the probability mass for each of those areas (and it's distribution and what happens to it), and that's finite either way.
Other than that, excellent video. Nice and clear for some relatively high level concepts.
The bias-variance decomposition is Part of my PhD thesis and i just gotta say your visualizations and explanations are very clean and intuitive. Good job!
Wow, thank you!
This presentation is phd level and beyond! So clear and easily digestible
I am glad it is still of relevance. It was one key element of my Doctorate dissertation 30 years ago even if I did not fully understood the relevance at that point. Best wishes fro your career if you are young and thank you for sharing.
Another great real life visualization of the concept is the following: Imagine two people playing darts. One of them hits all parts of the dartboard more or less symmetrically. They are on average in the middle, but each individual arrow might land oclose to the edges of the board. This is low or even zero bias but high variance. The other player's arrows always land very close to each other, but they don't center around The bullseye. The person is very focused and consistent, but can't get around the systematic missjudgement of the bulleye's position. Still, If they are close enought, they might win the majority of matches.
I am not a PhD. I would divide 7408 by 3. Then I would take 2469333…. And the square root is very close to pi. If you times it by two. That’s why the denominator I will do best with the largest no. You are not avoiding crystals.
The fact that I'm not particularly interested in statistics and also on my only 3 weeks of holidays from my maths-centric studies, yet I still was really excited to watch this video speaks for its quality. Thank you again for the amazing free content you provide to everyone!!
Thanks for the kind words!
Eth-Student?
@@peterlustig2048 indeed
@@CampingAvocado Cant wait to finally complete my master, I had so little free time the last few years...
@@peterlustig2048 Congrats to your soon to be acquired freedom then :)
I'm a PhD in statistics, never heard of that one before. It's really cool, thanks for sharing
Bullshit
I have to admit that as someone not very familiar with statistics I was starting to get lost until you got to the 2D vs 3D visualization and I immediately grasped what was going on. That was an excellent way to explain it, and reminded me a lot of 3blue1brown's visual maths videos.
Thank you!
It is pretty awesome that you covering one of the most counterintuitive examples in statistics. This example motivates many exciting ideas in modern statistics like empirical Bayes. Keep up the good work.
Originally Stein's paradox was just a bit of a footnote in my class in statistics, but when I dived a little bit deeper into it, it is actually a much bigger deal than I first thought, so I decided to share it here!
@@mathemaniac Yup, it is. Maybe next time, you can cover something from stein as well, like stein's identity, which is a pretty powerful tool for proving the central limit theorem and its generalisations. Sadly, there aren't many videos explaining it to a wider audience except to other graduate students.
I’m a layman but this doesn’t seem counterintuitive because the distributions are the same. So what if they’re unrelated … they share the same reality. Are you surprised that mass is measured the same way for a rock or water? It’s simply recursive…the more data sets you have the more likely one of the points will be to center. It’s a weighted distribution of a normal distribution.
@@randyzeitman1354 I am not entirely what you mean by "sharing the same reality" and the "weighted distribution of a normal distribution". However, this estimator would work when x_1, x_2, x_3 come from different datasets for example, X_1 can be from a dataset for the height of building, X_2 can be from a dataset for the average lifetime of a fly and X_3 can be from a dataset of the number of times a cat meows. If we want to find the average of each of these datasets, it turns out it is better to use the James stein estimator then if we were to take the average of each of these things. That is what makes it counterintuitive for me. I would like to hear your intuition though,
Does this paradox have any connection to the fact that random walk in 1 or 2 dimensions almost always returns, while in 3 and more dimensions it has a finite probability that it may never return? Proof for this uses normal distribution but I may be terribly wrong lol
Have you seen my idea list? (I mean I did post it on Patreon)
Yes, there is a connection! But the next video is just about the random walk itself (without using normal distribution / central limit theorem), because the connection is explored in a very involved paper by Brown:
projecteuclid.org/journals/annals-of-mathematical-statistics/volume-42/issue-3/Admissible-Estimators-Recurrent-Diffusions-and-Insoluble-Boundary-Value-Problems/10.1214/aoms/1177693318.full
Cool, I haven't seen your list, I don't use patreon. Can't wait for the next video
@@mathemaniac any tips on how to pay attention and stay interested and focused in statistics especially when it gets sso looonng and tedious??
@@leif1075 As someone with ADHD, I know very well how long and tedious lectures can make focusing literally impossible. Thus, I've given myself the liberty to give you a tip: try doing most of your research using resources that actually make the subject seem interesting to you. There surely are books that can teach even advanced college-level Statistics in simultaneously accessible and rigorous ways.
@@mathemaniac why is p there in p minusv2.. yiu didn't mention that at all
I think shrinkage isn’t widely discussed is because choosing MSE as a metric for goodness of parameter estimation is an arbitrary choice. It makes sense that introducing this metric would couple the individual estimations together, so it’s not really a paradox (in hindsight). In some sense, you want to see how well the model works, not how accurate the parameters are, since a model is usually too simplistic. But I do see this used in econometrics.
I think I’m seeing more L1 norm used in deep learning as the regularizer, wonder what form of shrinkage factor that will have?
I was wondering the same thing. The paradox seems to arise from the fact that our error is calculated using an L2 metric, but the two coordinates are being treated independently.
Aside from wondering how using an L1 norm would affect this, I was also thinking that rather than using two independent normal distributions whether this paradox would still exist if we used a 2-dimensional gaussian distribution. Because in this case, all points with the same distance from the center would now all have the same probability, which wouldn't be true using two independent normal distributions.
I was thinking the same thing. This isn't a better estimation, this is a trick that takes advantage of how we measure things.
The relevance of "mean square error" here can be considered in the context of the probability distribution of the error. Here "error" means total squared error as in the video. Applying the shrinkage moves part of range of errors towards zero, while moving a small part of the range away from zero. The "mean squared error" measure doesn't care enough about the few possibly extremely large errors resulting from being moved away from zero to counterbalance the apparent benefit from moving some errors towards zero, But any other measure of goodness of estimation has the same problem. There are approaches to ranking estimation methods (other ways of defining "dominance") that are based on the whole of the probability distribution of errors not just a summary statistic. This is similar to the idea if "uniformly most powerful" for significance tests. The practical worry here is that a revised estimation formula can occasionally produce extremely poor estimates, as is illustrated in the slides in this video.
Statistics seems to shun elegance for practicality more than most branches of mathematics. The ordinary estimator is clean and intuitive while the James-Stein one is like a machine held together by duct tape, yet the latter works better in many cases.
I feel like you might be missing out on something if the James-Stein Estimator doesn't seem elegant by the end of this video.
I would say this formula is more transparent in terms of what it does and why it works than most of the stuff we memorize in algebra.
It is entirely possible I'm the weird one for looking at this and thinking "yeah, that looks like the right way." Different brains understand things in different ways.
No, the James-Stein estimator is biased and practically useless. Note that it doesn't matter which point you shrink towards, it will lower the error. That by itself should tell you how ridiculous this is.
What we are truly looking for is the minimum-variance unbaised estimator. That is the definition of the "best" estimator.
All this video shows is that MSE is insufficient to determine the best estimator. There are biased estimators with less MSE than unbiased ones.
@@KirbyCakeLoL Really reminded me of Goodhart's law here " When a measure becomes a target, it ceases to be a good measure." James Steins estimator chase the target of being "best" estimator which resulted in the failure of this "best" estimator.
@@KirbyCakeLoL Of course the James-Stein estimator is very rough and rudimentary, but the point of the video is how it served as inspiration for the idea of Bias-Variable tradeoff. So back to the point of elegance vs practicality. Minimum-variance unbiased estimator might be what you are "looking" for, but in reality that is just a conceptual dream. Bias-Variable tradeoff and how it's widely used in real world machine learning applications for regularization is the practical part that can't be dismissed and already applied everywhere.
This is a masterclass in how to teach statistics, absolutely incredible work. Scripting, visualization, pacing, everything was on point
Glad you enjoyed it!
I'm not all that familiar with advanced statistics, but I was pretty blown away by this paradox when you first presented it! However, once you started explaining how we normally throw out outliers in any case, It began to make a lot more sense. Good video!
All this paradox comes from trying to minimize the squared errors.
The squared errors are used mostly because its easy to compute for most of classical statistics law and it fit prety well with most minimization algorithms. But in real world,in many cases, one will be more interested of the average absolute errors instead of squared errors.
I think the "paradox" is there, we are using a arbitrary metric, and we never question it.
When I used to be a quantitative analyst I often used the abs value instead of squared for error minimization, I found the result way more relevant despite some slight difficulty to run some algorithms.
Exactly my thoughts. This seems to be an artifact of the metric we use rather than of any reality. Probably with a taxi distance this would disappear.
This was my first time to encounter Mathemaniac, and I was impressed with this video. Good job!
Thank you so much!
such a cool video, I am a Machine Learning engineer and use regularisation techniques like shrinkage daily yet I didn't know it's origins were rooted in a paradox!
Great to hear!
Never did anything like "shrinkage", and didn't get how all of this connects with machine learning. Until 45 seconds before the end, when suddenly all the pieces connected and I realized that I had been using shrinkage. And that the five-dimensional data in the database (which gets aggregated into four-dimensional data, which is then fed into the ML algorithm as a two-dimensial field) actually consists of 50,000-dimensional vectors. Ah, yes, the happy blissfully unaware life of an engineer!
Anecdotal evidence:
A group of engineers and a group of mathematicians meet in a a train, both travelling to a congress. The engineers are surprised to learn that the mathematicians only bought one ticket for the whole group of mathematicians, but the mathematicians won't explain.
Suddenly, one mathematicians yells "conductor!". All mathematicians run to the toilet and cram themselves into the tiny room before locking the door. The conductor appears, checks the tickets of the engineers and then goes to the toilet, knocks at the door and says "ticket, please!". The mathematicians slide their single under the door to the conductor, and the conductor leaves, satisfied.
When the mathematicians return to the group of engineers, the engineers complement the mathematicians on their method and say that they will use it themselves on the return trip.
On the return trip, the engineers arrive with their single ticket, but are surprised to learn that the mathematicians had bought no ticket at all this time.
Suddenly, one mathematicians yells "conductor!". All engineers run to the toilet and cram themselves into the tiny room before locking the door. One mathematician walks to the toilet, knocks at the door and says "ticket, please!".
TL;DR version: the engineers use the methods of the mathematicians, but they don't understand them.
@@klausstock8020 This joke made the video all the more worthwhile.
@@klausstock8020 Good story! I had thought the mathematicians would cram into the same bathroom with the engineers, but the actual ending was even more brilliant!
This is a great explanation of estimators and non-intuitive relations. I like that you highlighted its importance in machine learning. It would be worth doing another video about how the variance/bias relation and subsequent weightings adjustments affect those models, especially in the context of overfitting.
Will have to think about how to do it though... thanks for the suggestion.
I kept forgetting that the distributions were unrelated and every time I remembered, it blew my mind. Absolutely fantastic video
What a great video! For me you perfectly hit the pace. I was never bored but still didn't need to rewatch sections, because they were too fast.
This is one of those beautiful paradoxes which you can't beleive, if you haven't seen the explanation.
Glad you enjoyed it!
I've been using regularization on a daily basis and this is the best explanation on why shrinkage might be desirable I've ever seen. Bravo.
Great to hear!
As a male who swims in cold water, I agree.
The paradox stopped feeling paradoxically to me as soon as i realised that it all comes from adding all the errors together with equal weights. That already assumes that the estimated values are all on the same scale, are worth the same. There is not a lot more steps from there to assuming all the samples estimate the same value.
We could for example have had one estimated value being in the magnitude of 10^24 and the other around 10^-24 and one would clearly decide against just adding the estimation errors together like one does here.
The variance from the mean is the same for all (1). So even if one mean is 10^24, the samples you collect will most likely be within +/- 1. And similarly the 10^-24 guy will still give you samples in 10^-24 +/- 1
The reason the Stein guy performs better is that the error is sum of 3 things. And there is a way to adjust your "estimator" so that it isn't the best for any one of the 3 variables, but the total is still less.
@@vishesh0512 oh yeah you're right, i forgot the fact that the variance of each is 1. Thank you, your explanation is better.
That does make the JS estimator pretty powerful though. Evem though one could think of other ways of combining the errors other than summing, summing seems to be the very obvious choice.
Yes. The OP kept saying “completely independent distributions,” but that is an inaccurate description of the problem. A vector in n-dims is a single object, not the same as n separate distributions on n axes. The latter has nothing to do with Stein’s paradox, and actually the way this video begins is incorrect and does have an answer of the naive estimates as presented.
In fact, one can even read on Wikipedia: “In practical terms, if the combined error is in fact of interest, then a combined estimator should be used, even if the underlying parameters are independent. If one is instead interested in estimating an individual parameter, then using a combined estimator does not help and is in fact worse.” For a 21+ min video, you would think the author would at least spend the effort to accurately present the problem at the beginning.
this was really good, thank you! I used to work in a machine learning/DSP shop and did a lot of reading about estimators but I'm not sure I ever fully understood until I saw this video.
This is one of the most counterintuitive things I've ever seen! Statistics is crazy.
I did my PhD on shrinkage estimators of a covariance matrix. This is the best vulgarization of Stein's paradox I have ever seen! Thanks
people might read the word "vulgar" and assume you're negatively criticizing the video
I found it a bit funny how recently statistics has become interesting (again), by referring to machine learning.
But hands down: Great concept of two channels for "the engineer version" as well as the full details and your general style of teaching.
Very understandable, good to grasp and intriguing. Subbed
It was always interesting to us scientists and people who are interested in making empirical deductions. Transformer models aren't the only reason to be interested in statistics.
Idk what I expected by watching it or why I watched it having a nonexistent education of statistics.
At least now I know that I don't understand yet another semi-complicated concept in this universe.
Judging by the comments you did a decent job of explaining and visualizing this topic.
Keep up with the good effort!
To my physics-trained eyes, the formula at 3:00 looks incorrect or at least incomplete for general variables having units. Are all _x_ components expected to be dimensionless and normalized to σ_i = 1? But where would one get the σ_i from?
I believe all that's required is the inputs are dimensionless, so you can do the naïve thing and divide by the unit or be more precise by using some physical scale for that dimension if it's known.
Aha, on Wikipedia the James-Stein estimator is shown with σ² in the numerator, which would indeed take care of units and scale. Alas, this makes the estimator _dramatically less useful_ in real-world situations because it can only be applied if σ² is known _a priori_ .
I was thinking the same thing. If you wanted to define a shrinkage factor that works for data sets with variances that aren't normalized to 1, you'd need to explicitly write that into the equation. I.e. every time there's an x_i in the shrinkage factor, you'd replace it with x_i/sigma_i.
One consequence is that the James Stein estimator can only be used if you know (or have an estimate for) the variance. And if you have only an estimate for the variance (which is the best you can hope for if you don't know the true distribution already), then that can deteriorate the quality of the estimator.
No, that's not true. Also on Wikipedia, you can apply the James-Stein estimator if the variance is unknown - you just replace it with the standard estimator of variance.
@@sternmg the JS phenomenon was only ever meant to be a counter-example of sorts, not applied statistics -- that's why they didn't bother defining an obvious improvement that dominates the JS estimator (to wit, the "positive-part JS estimator" that sets the estimate to zero when the shrinkage factor goes negative). If you want practical shrinkage methods use penalized maximum likelihood with L1 ("lasso") or L2 ("ridge") penalties (or both, "elastic net") or Bayes.
Really great video, incredibly paced. The question that occurred to me is: Are we just abusing the definition of mean square error passed it's useful/intended use? Are we sure that lowering it is ALWAYS desirable?
Good point. I think it's pointless to minimize the mse if the estimator you are using is biased (the James-Stein estimator is).
@@jsupim1 This is a really naive thought that, sadly, pervades much of even professional science. While I can see your thinking on this in the context of a "broad-use" estimator like James-Stein--I disagree, but I see it--this thought simply falls apart when applied to a more nuanced scenario.
Imagine a situation where you want to use relatively little data to infer something about a highly complex system. Say, data from an MRI to infer something about brain vasculature. There are dozens upon dozens of parameters that might affect even the simplest model of blood flow in the brain: vessel size distributions, arterial/venous blood pressure, blood viscosity, body temperature, and mental and physical activity levels. If you leave all of those as fitted, unbiased parameters, you do not have enough information to solve the inverse problem and retrieve your answer. (For the sake of argument, let's say average vessel size is what you're interested in.) So the unbiased estimator totally fails, as the mse is many times larger than the parameters.
Now open up the idea of parametric constraint, a special case of the broader "regularization" described in this video. Let's say you measure blood pressure before someone enters the scanner, use 37C for temperature, go to literature to find the average blood viscosity, and assume all vessels are one unknown size in a small region. None of these will be _exactly accurate_ to the patient during the scan. What you've done is created a biased estimator that might just be able to work out the one thing you're interested in: average vessel size. Unless your guesses are very, very wrong, it will almost certainly have a lower vessel size mse than the unbiased estimator.
Thank you, this is exactly how I feel. As soon as MSE leads us to use information from non-correlated, independent distributions to make deductions on the one under focus means MSE is wrong. That needs to be an axiom of statistics or something. Valid Error systems cannot have dominant approximators that use info from outside, non correlated systems.
@@chrislankford7939 all of those distributions will be correlated, so your example doesn’t apply.
@@phatrickmoore I think your intuition leads you astray, just consider genetic algorithms for optimization problems. These can often outperform any deterministic approach, even though they use stochasticity (hence random variables drawn from distributions that are independent from the optimization problem).
I haven't thought about this in detail at all, but is this counterintuitive result dependent on the use of the mean squared error? Would it be avoided if one used eg the mean absolute error instead? (If so, doesn't it amount to a reductio ad absurdum refutation of the use of mean squared error?)
It happens because MSE treats errors in each parameter as comparable. If you think about actually estimating quantities of interest you'll see that the MSE as expressed here isn't dimensionally consistent: there's an implicit conversion factor that says that whatever the variance in the individual components is, that sets the scale for how errors in different components are traded off against one another. It's the way this trading off of errors in the different components works that leads to the the shrinkage estimator dominating the maximum likelihood estimator. I haven't checked but using mean absolute error would require an the same trading off of estimation errors so I'd expect to have a James-Stein-style result with that loss function too.
@@coreyyanofsky If you had some data set where errors in dimensions aren't comparable because, say, you weigh error twice as heavily in x_1 than in x_2, then you can just scale x_1 by a factor of two and try to estimate 2mu_1, and the paradox still happens. I suppose instead you may be completely unwilling to compare the dimensions, but then "best estimator" for the set is meaningless. This is strange.
@@terdragontra8900 If you change the weighting so that you're no longer variance 1 in some component then the loss function is weighted MSE and the sphere in the video becomes an ellipsoid; this will make the math more complicated for no real gain because the JS phenomenon was supposed to be a counter-example of sorts and not applied statistics.
Wouldn't reweighting the MSE just lead to a weighted JS estimator?
I think they key insight is that, in higher dimensions, it's not like you're getting a better estimate *for each separate dimension* than you would've if you'd estimated each separately. But the, like, "length" of the error vector will be less.
The problem might be how we ought to be interpreting that length.
Nice video! I have studied machine learning since 2014, I have heard the term "bias-variance tradeoff" multiple times and only now I understand. Thank you so much for the explanation.
This just blew my mind. I kept expecting to see some disclaimer come up that would relegate this paradox to purely an academic context. But dang, this concept is incredible!
A lot of people say that they find the Banach-Tarski theorem to be upsetting, but this result is so much worse than that. You can make the Banach-Tarski phenomenon go away with some pretty weak continuity assumptions, but this is a really strong result that applies in real-world situations and isn't going to go away no matter what you throw at it. In fact I suspect you can make some pretty sweeping generalizations of it. I think the main reason I find it so hard to accept is that I have a really strong intuitive sense that there should be a unique "best" estimator -- i.e., you shouldn't be able to get a better estimator by biasing it in an arbitrary direction, which is exactly what happens with the James-Stein estimator. I suspect that, based on similar reasoning to what's presented in this video, you can show that, in these kinds of situations, there can be no unique "best" estimator. (Edit: I originally had "admissible" where I now have "best", but I've since realized that's not really what I meant.)
The fact that this method treats the origin special should already be a red flag that something is off. The only thing that can be off is the way we measure how "good" an estimator is. There are several options that seem equally valid. Why do we take the square deviation? Why do we take the sum of the expected values? Why not the expected value of the Euklidean norm of the deviation? Or maybe we shouldn't take any squares at all?
It does not need to be the origin - you can equally shrink towards some other point (but pre-picked), James-Stein estimator still dominates the ordinary estimator.
As to the mean squared error, I agree that this is somewhat arbitrary, but it is partly due to convenience - the calculations would be, normally, the easiest if we just take the squares; and without these calculations, we wouldn't be able to verify that James-Stein is indeed better. But if you adopt the view of Bayesian statistics, then mean squared error has a meaning there - by minimising it, you are taking the mean of the posterior distribution.
The relevance of "mean square error" here can be considered in the context of the probability distribution of the error. Applying the shrinkage moves part of range of errors towards zero, while moving a small part of the range away from zero. The "mean squared error" measure doesn't care enough about the few possibly extremely large errors resulting from being moved away from zero to counterbalance the apparent benefit from moving some errors towards zero, But any other measure of goodness of estimation has the same problem. There are approaches to ranking estimation methods (other ways of defining "dominance") that are based on the whole of the probability distribution of errors not just a summary statistic. The practical worry here is that a revised estimation formula can occasionally produce extremely poor estimates, as is illustrated in the slides in this video.
@@djtwo2 That's what the video itself says.
But there is no explanation given for that awkward quality metric over several dimensions. It's just a sum over each dimension without any further justification. Honesty, I would expect a norm on the higher-dimensional space on the bottom of the formula, then taking expectation of the squares like in 1D. But that's not what's happening. I mean expectation value is a linear operator so it may boil down to the Euclidean norm.
What disturbs me on this method is that it is not scale invariant. Let's say we have three random measurements of distance, 1 m, 2 m, and 3 m. Then the estimates would be 0.92, 1.85, and 2.78. But if we express the same measurements in feet, calculate the estimates and then convert them back to meters, they will be 0.99, 1.98, and 2.98. That does not sound right. Or did I miss something?
The MSE as expressed in the video is dimensionally inconsistent for measurements with units. Implicitly the variance is setting the scale here -- you measure in units such that the standard deviation is 1, and this scaling eats the units.
The estimator requires that all component quantities be normalized, i.e., to be dimensionless and have variance 1. This means real-world input components must all be scaled as x_i := x_i/σ_i, which means that all component _variances must be known beforehand_ . That is not exactly practical and also makes the estimator less miraculous.
You can use the usual estimate for the variances (if you have more data points, in which case, the means still follow normal distribution, just with different variances), and the James-Stein estimator still dominate the ordinary estimate, so you don't have to know the variances actually.
10:39 i mean nowdays if you're doing anything at all sensitive on a non-https website you're making a big mistake.
10:55 browser fingerprinting is a thing and can often uniquely identify a device. sure, a vpn makes it a bit harder, but unless you're hardening your browser (which anyone in the intended audience of this ad is not doing) it doesn't matter that much.
There is something satisfying about an idea going from ridicules to obvious in a short span of time.
Incredible video! I never fully understood why regularisation works especially with penalised regression but this video explains it very well.
Thank you!
Static 0:59 bcaa CBRN apex shocks 2:09 WIMP filtered politics 3:00 variable quality vs survival evolving cordons 6:21
As a graduate student who has poured through countless math explanation youtube videos in the past years, this has to be one of the most beautiful! The writing, the story, the visuals, and the PACE --- all skillfully designed and executed. Definitely recommending this to my peers. Great fun to learn something new in this way. I appreciate your work greatly!
Thank you so much for the compliment! Really encouraging!
This could be wrong but I see an example to illustrate this in real life: Consider a box of screws of varying length. Now randomly pull a screw. The length of the screw will be the data point. The tolerance will be the mechanical variation in length. Let’s also add the requirement that the variation will be consistent across all screws, just as the variance is the same in the data point examples at the start. Intuitively and mathematically, then, more information about the actual value of the tolerance, which is unknown will be accumulated as more screws are examined. This information can be used to predict how close the actual “ideal” length of the screws compares to the observed length. You can then select “better” screws from what has been accumulated. The apparent independence of the samples (length) is an illusion because they share a common value of the variance or spread.
This is another great example of how higher dimensional space defies intuition.
I don't think you did a very good job in the introduction of giving motivation for why it would even be possible to find a better estimator than our naive guess. As the video went on it made sense, but at the beginning when you were introducing the concept of multiple independent distributions, I wish you had included a line like "we are trying to find the best estimator overall for the system of three independent distributions, which may not be the same as the best estimator for each independent distribution".
Thanks for the feedback! I did initially want to include this into the script but eventually decided against it. This is because when I first read about Stein's paradox, and that it is because of reducing the overall error rather than individual errors, I just moved on, because I immediately felt the paradox is resolved. But when I read about James-Stein estimator again (because of the connection with the next video), I realised it was a much bigger deal than I thought it would be, like the idea of shrinkage and bias-variance tradeoff. In my opinion, this would be a much, much more important concept.
In other words, if I said the line that you suggested, in the beginning of the video, my past self just would not continue to learn the much more important lessons later on in the video. So perhaps if given the second chance, I could have said it at the end of the video, but I would still not put this in the beginning.
@@mathemaniac Ah, but you must also know that burying the lead for tactical reasons is a very dangerous game.
My formal math education predates Moses, but I think I still have good instincts, most of the time. In my own writing practice I often take wildly unconventional paths, to help break people out of established cognitive grooves. It's a useful posture, and sometimes it's not bad to inform the process from an introspective stance on _your own_ foibles and aversions.
But you also have to be as honest as possible up front, and not go "hey, surprise, bias!" in the third act, when the gun was already smoking at the first rise of the curtain. Surely there's only one possible unbiased estimator for a symmetric distribution. You know, that first screen you introduced. Which way would you deviate? It's symmetric, you can't choose.
Having but one unbiased estimator on the store shelf, if you have no bias tolerance, you are done, done, done in the first act. This was making me scream inside for the first ten minutes. And then if you go on to show that least squares estimation steers you into a biased estimator, what you _ought_ to conclude is that least squares (as applied here) is _totally inappropriate_ for use in regimes with zero bias tolerance. Which is an interesting result on its own terms.
Furthermore, I had a lot of trouble with the starting point where you know the variance for certain, but you're scrabbling away with one data point to estimate the mean. Variance is the higher moment, which means we are operating in a moment inversion (like a temperature inversion over Los Archangeles), where our certitude in higher moments precedes our certitude in lower moments, which is pretty weird in real life. So I mentally filed this as follows: in an Escherian landscape where you know your higher order moments before your lower order moments (weird), then sometimes grabbing for least squares error estimation by knee-jerk habit will either A) lead you badly astray (zero bias tolerance); or B) lead you to a surprising glade in the promised land (you managed to pawn some bias tolerance for a dominating error estimator).
I admire your thought process to take a motivated, pedagogical excursion. But failing to state that the naive estimator is the only possible unbiased estimator at first opportunity merely opened you up to a different scream from a different bridge. Because this whole thing was The Scream for me for the first ten minutes. So then your early segue is "but look at the surprising result you might obtain if you relax your knee-jerk fetish for zero bias" and _then_ I would have settled in to enjoy the ride, exactly as you steered it.
@@mathemaniac I had to get that first point out of my system, before I could gather my thoughts about the other aspect of this that was driving me nuts.
It was pretty clear to me from early on that if your combined least squares estimator imposed a Euclidean metric, that you could win the battle on the kind of volumetric consideration we ended up with. I'm am _totally_ schooled on the volumetric paradox of high-dimensional spaces (e.g. all random pairs of points, on average, become equidistant in the limit; I usually visualize this as vertices of discrete hypercubes, with distance determined by bit vector difference counting - it's my view of continuous mathematics that has degraded greatly since the time of Moses).
But then I had a minor additional scream: why should our combined estimator be allowed to impose a Euclidean metric on this problem space? When did this arranged marriage with Euclid first transpire, and why wasn't I notified? Did Gauss himself ever apply least squares with a Euclidean overlay informed by independent free parameters? It seems to me that if you just have many instances of the same thing with a _shared_ free parameter, and complete indifference about where your error falls, this amounts to an obvious heuristic, without much need for additional justification.
But then when you have independent free parameters, the unexpected arrival of a Euclidean metric space needs to be thoroughly frisked at first contact, like Miracle Max, before entering Thunderdome, to possibly revive the losing contestant.
Tina Turner: "True Love". You heard him? You could not ask for a more noble cause than that.
Miracle Max: What's love got to do with it? But in any case that’s not what he said-he distinctly said “To blave”-
Valerie: Liar! Liar! Liar!
Miracle Max: And besides, my impetuous harridan, he was worked over by a chainsaw strung from a bungee cord, and now most of his body is scattered around like pink wedding confetti.
Valerie: Ah, shucks.
@@mathemaniac Final comment, sorry for the many fragments.
1) you're willing to sell bias up the river (but only for a good price)
2) you're in an Escherian problem domain where a higher order moment is fixed in stone by some magic incantation (e.g. Excaliber) while a lower order moment is anybody's guess
3) you don't find it odd that your aggregated error function imposes a Euclidean metric space
then
4) you arrive at this weird, counterintuitive, nay, positively _paradoxical_ result
But, actually, for me, by the time I've swallowed all three numbered swords, any lingering whiff of paradox has left the building with all limbs normally attached.
@@afterthesmash Re: the variance point. If you use a lot of data points to estimate the mean for each distribution, then you will still be able to obtain an estimation of variance, and use that to construct the (modified) James-Stein estimator, and it will still dominate the ordinary estimator. More details on the Wikipedia page for James-Stein estimator.
I am wondering…
If I had a single measurement to estimate in one dimension. Could I use a random number generator to create data sets in two more dimensions, then use the James Stien estimator to get a more accurate result? Basically shoehorn the estimator into a one dimensional problem?
Heh. Good thought, but nope: This is about the "best" overall guess for the whole set of variables with the same variance; there's no saying which mean you will have the biggest error guessing. If you think of the p-2 over the division line as your degrees of freedom, and you do the J-S equation for 4 numbers, then run a second number on each variable and remove the worst fit to get down to 3, chances are equal that it's the variable you wanted to shoehorn which gets tossed.
Thanks!
That's a really cool paradox, great video!
Question about the "best estimator": Would this definition mean always guessing 7 is also an admissible estimator because no other estimator can have mean squared error = 0 in the case that the actual mean is 7?
Yes! I originally wanted to say this in the video but decided against it to make it a bit more concise. Indeed, your observation adds fire to the anger by those statisticians who really believed in Fisher - admissibility (what I called "best" estimator) is a weak criteria for estimators, but our ordinary estimate fails this!
@@mathemaniac around 14:30 you just mean a higher distance results I smaller shrinkage because since the denominator is getting larger, the entire term p Mina 2 over tbst distance will shrink since the numerator stays the same..that's all you meanr right?
@@leif1075 Yes - if the original distance is large, then the absolute reduction in distance will be small, because the original distance is in the denominator.
@@mathemaniac I read somewhere that the James-Stein estimator is itself also inadmissible. Is there any "good" admissible estimator?
The main reason that this is counter-intuitive, IMHO, is that it does not have the obvious symmetry. Suppose we sample from [N(m1,s1), N(m2,s2), N(m3,a2)] and get [x1, x2, x3]. Suppose our estimator for [m1, m2, m3] is [m'1, m'2, m'3]. This might be [x1, x2, x3] or it might not. Now suppose we get [x1+t1, x2+t2, x3+t3]. Imagine the t1, t2, t3 as being very large. Surely our estimator should be [m'1+t1, m'2+t2, m'3+t3]. The problem has a symmetry, so surely our solution should exhibit the same symmetry. The James-Stein estimator does not have that property.
But here's the thing. If a problem has a symmetry, then the set of all solutions must have the same symmetry, but unless the solution is unique no individual solution needs to have that symmetry. Spontaneous symmetry breaking and all that. So there are other James-Stein estimators which are given by taking the origin to be at [u1, u2, u3], and these also beat the [x1, x2, x3] estimator, and the set of all of them has the expected symmetry.
Yes - you can also shrink it towards any other arbitrary, but pre-picked point. You can even think of the ordinary estimate as just shrinking towards infinity.
A fantastic demonstration of the Stein's paradox. Literally one of the best math videos I've watched
Thank you so much!
Currently studying ML and went over Thompson Sampling recently . This is a great video as i immediately saw the similarities and was able to follow along even though i knew nothing about ML before i got started. Definitely subscribing .
It made sense to me that the variance was the cause of the paradox but the real reason is mind boggling.
never knew the link between shrinkage and regularisation... good stuff.
The way hypervolumes have such dense neighbourhoods seems to be very interesting and useful in many places - I suspected it'd be involved as soon as you mentioned 'in 3 or more dimensions'. And that stems from a little personal experience I had.
I was working on a quality optimisation computation in 32 dimensions a while ago and opted to use simulated annealing algorithm, on a hunch that stochastic algorithms would scale best in this higher number of dimension.
I had to laugh when trying to figure out a sensible distance function (used to govern how far the sample picker would jump in an iteration). We had felt overwhelmed by the size of the sample space since the start, but I began to realise that all these trillions of coordinates were in fact within only a few nearest neighbours of each other.
I have a naive question about why this works: So given the original setup, you basically draw numbers (mu) in the range from [-infinity,+infinity]. If all numbers are equally likely, the expected value for this drawing should be zero? Then we get a second information, that is the single confirmed value that we know for each distribution.
Given that the expected value of all mus should be zero, can we just assume that it is more likely that the actual mu is slightly closer to zero than the number we know? However if you shrink too much you will also lose out on accuracy. Therefore there could be an optimal "amount" of shrinkage?
Does this make sense?
I think the expected error will always be the same no matter what the shrinkage factor is? A uniform distribution is basically a straight line, so it'll look the same no matter how you stretch or shrink it.
The variance of the distributions is (infinity - infinity) / 2 = ...dammit.
Ok let's draw numbers from the range [-x, x] instead. So now the variance of the distributions is (x - x) / 2 = 0, which approaches 0 as x approaches infinity. The shrinkage factor basically multiplies this variance, and 0 multiplied by anything is still 0.
(Don't quote me on this, I don't know much about statistics, but this just made sense to me)
It reminds me of the Curse of Dimensionality. Some stuff works well in 2D but not in higher dimensions.
It’s like the “sphere between 1-unit spheres packing a 2-unit cube”. If you draw a circle that touches the inside of 4 unit circles forming a square, it would have a radius of √2-1 ≈ 0.414 units; if you draw a sphere that touches the inside of 8 unit spheres forming a cube, it would have a radius of √3-1 ≈ 0.732 units. But for 4D and up, the center hypersphere is the same size as the corner hyperspheres (√4-1=1), and in 5D and above, the center hypersphere is bigger, and eventually becomes uncontainable in the hypercube.
Also, don't forget that the mean squared error is an arbitrary definition of error, used mostly because squaring something makes it positive without making a huge mess of the algebra. It arguably has nothing to do with intuition, it puts far more weight on large errors than our intuition might. I feel like my intuition is closer to mean-absolute than mean squared.
Would the JS-estimator or anything else be better if we used mean-absolute error?
The intuitive explanation given in this video does not really have anything to do with the exact form of error that we consider. It might not be the JS estimator, but some other shrinkage estimator might dominate the ordinary estimator, e.g. www.jstor.org/stable/2670307#metadata_info_tab_contents
But as you noted, the algebra is going to be messy, and it will be very difficult to obtain a definitive answer, just empirical evidence.
@@mathemaniac Thanks. I could be missing it (there's a lot in there I cannot parse) but it's a bit unclear to me what they have found there, it doesn't seem to claim that it dominates in LAD error. They say "Finally, using stock return data, we present some empirical evidence that the combination estimators have the potential to improve out-of-sample prediction in terms of both mean squared error and mean absolute error." which seems like a much weaker claim.
Anyway, thanks for your video, it was very interesting and well presented. Just LS-error has always bugged me, it was chosen for convenience, we should expect unintuitive results sometimes.
very unintuitive. Outstanding content. Thought provoking. Love it! Keep it up.
Glad you liked it!
I like to give deriving the James-Stein estimator as a homework problem when teaching Math 541b at USC. Cool stuff!
Awesome video, would love some more statistics content. Pure maths people don't pay it enough respect :)
This is an well made video. Clear visualizations and amazing explanation. Keep it up
Thank you very much!
Congratulations on reaching 100 K subscribers! I think this channel will continue to grow because the content is very high quality and there aren't many like this.
Thank you very much!
How to avoid hard work and use useless data by fetishizing and obfuscating one's profession
How does this result connect with Bayesian estimation? To me it seems to make sense that the reduction starts to happen at 3 sampled points because there is an implicit (within the MLE estimator) prior hyper-parameter distribution on the supposedly-independent distributions, namely that their (improper) prior means are uniform on the Real line. But once you have sampled from at least 3 of these distributions, you now have enough data from the hyper-prior distribution to outweigh the improper uniform prior of the individual distributions. Namely, the hyper-prior on the original 'independent' means should be updated to be somewhere close to the average of the three sample points.
So, I imagine that if this whole scenario was rephrased in terms of a hierarchical Bayes model, with hyper-parameters for the means of the multiple distributions, you would not only get a better estimator than the naive MLE estimator, but you'd almost certainly eliminate the negativity flaw in the James-Stein estimator.
I'm a Bayesian and I don't think there's necessarily a connection here. This phenomenon happens because of the way the loss function trades off estimation error in the different components of the estimand. This particular loss function is not an essential piece of Bayesian machinery, and if you think about it, Bayes licenses you to shrink whenever the prior information justifies it even in 1 or 2 dimensions.
James-Stein estimator is also an example of an empirical Bayes estimator. You can derive it by considering the prior distribution as centred around the origin, but the variance-covariance matrix is estimated from the data itself.
@@mathemaniac Thanks!
My impression is that the reason shrinkage works is fundamentally because we have an additional bit of information a priori: Values closer to 0 are more likely than values further away. This becomes obvious with very large numbers. We know intuitively that any distribution we encounter in real life will be unlikely to have a mean above 2^50 lets say.
This is important because for values far from zero, the James Stein Estimator loses its edge. If we didnt assume a bias towards 0 and would truly consider all possible values equally (eg a mean of 2^50^50 is just as likely as a mean between 0 and 1 million), we would see that the James Stein estimator is in fact not measurably better over all possible numbers (its average error approaches the same limit as the simple estimator). Its just better for numbers close to 0, which turns out to include any distribution we will ever encounter at least to some degree because nature is biased towards number closer to 0.
If you know a priori that your true value is actually very large, you can shrink towards that far away point instead! There is nothing special about 0.
If you consider all numbers, any finite positive number you pick, no matter how large, will still be small in the sense that there is an infinite range of larger numbers than your chosen number, but only a finite number of smaller positive numbers. So compared to all numbers, we cannot help but pick numbers close to 0! Knowing this, we can bias towards small numbers and improve.
Any other number you might chose to shrink to is special too because in the same sense it is also a small number (it might be better than or worse than 0, but just like 0 it will help at least a little bit).
If you "shrink" towards infinity, I think that will only help if you change the methodology a bit and shrink not based on the distance to infinity (that would get you just a constant additive shift to all values - that doesnt help) but based on the distance to a finite set point. So again, as you get further from the set point, the benefit of shrinking will decrease and approach 0.
That being said I am confused as to why shrinkage doesnt work in 1d and 2d, so maybe I am mistaken.
Can I be honest?
I know i can.
I just freaking love your videos.
Thank you so much!
Amazing video - perfectly paced and exactly right amount of background info!
Glad you enjoyed it!
As soon as you started talking about bias-variance tradeoff I started thinking about biased sampling in Monte Carlo methods (and in rendering in particular). Sometimes it's worth losing the eventual convergence guarantees of the unbiased estimators if it also kills the sampling noise that high variance introduces.
Interesting tutorial, but what on earth does the statement at 20:28 mean ? Thanks.
Go to nordvpn.com/mathemaniac to get the two year plan with an exclusive deal PLUS 4 months free. It’s risk free with NordVPN’s 30 day money back guarantee!
It will also greatly help the channel, so do sign up!
I'm taking advanced econometrics this semester and this James-Stein approach came up as one of the example of shrinkage estimator. Felt like spotting an easter egg in a movie haha
oh baby :D have no time for it now, but gonna watch it this evening.. :P :)
I saw a talk on this at my uni about a year ago. This paradox is so fascinating imo
the bestimator
Congratulations on 100K! You are the best!
Thank you so much!!
huh never knew statistics could be this interesting lol I've always been just meme-ing on it
It's just that people don't know the principles behind statistics, or just thought statistics is just the mean, mode, median stuff, when in reality, there is a huge theory on parametric inference.
The statistics nerds on the side starts chanting "One of us, one of us" and eventually, with 95% probability, you'll be one of them too!
Probably.
Amazing video! But I have one nitpicky comment:
at 15:00 your arrows are misleading, the shrinkage factor is actually the same for the bottom left arrow and for the "near end" arrow
Wait, doesn't this depend on where the origin is? Naïvely, I would have expected that the choice of origin should not affect our estimator.
Yes, but... the dominance result holds whichever point you shrink to, i.e. if you have pre-picked a point, then adding a shrinkage factor towards that point to form the James-Stein estimator would still dominate the ordinary estimate.
You can think that the ordinary estimate is "shrinking" the sample towards infinity if you will.
@@mathemaniac in that case does the James-Stein estimator only works if the variance is 1?
@@falquicao8331 Yes, if you know the variances in advance you can modify the estimator by dividing by the coordinates variance somewhere. But the estimator does not work if it is not known in advance (which is typical in a practical setting)
It still works if the variance is not known in advance. You just have to modify the variance to be the standard estimator for variance. The dominance result still holds.
@@mathemaniac thats crazy
Well-made video. Smartly written script. Interesting stuff.
Glad you liked it!
The fact that this works makes me irrationally angry lol. Thanks for the video, I did not know about this "paradox"
Haha that was also the reaction of many statisticians back then when they heard from James and Stein!
The thing that irks me about this is that you didn't contract best and estimator to bestimator.
What you failed to make clear, is that an estimator for 3 variables is completely different from 3 estimators for 1 variable each.
So, what the James-Stein estimator is doing, is basically making some of the estimates worse, and some better. Such that the total sum of error across all of them is less, but the actual estimate for each one on their own is likely worse.
"An estimator for 3 variables is completely different from 3 estimators for 1 variable each" - maybe the perspective might be different, these two situations are completely the same mathematically, essentially depending on whether you call the vector and its components "completely" different. (Maybe I interpreted your statement wrong, though)
But I do agree that James-Stein estimator makes some of the estimates worse and some better, but overall better. However, this is very difficult to illustrate, and I just aim to explain the advantage of shrinkage instead, because that is the much more important message applicable to modern statistics / machine learning.
@@mathemaniac They aren't the same though. Because the James-Stein estimator performs worse on some estimates, a singular such estimator will be outperformed by some mix of the naive and James-Stein estimators.
The estimators themselves are the same - it is just the components of a vector, but *how we measure its performance** are different. In one case, we measure it using the overall error; in another, we use just one singular error.
if you have only one data point you do not estimate µ, instead you get a second data point
0:28 "Suppose I have a set of data that follows a normal distribution with some unknown mean mu and a variance of 1"
What is the distribution of possible mu values?
Think of it as "I know what mu is, but I just don't tell you". To be honest, this is more of a frequentist view than the Bayes view you said in your comment.
wouldn't it be just uniform?
@@gaboqv Is it valid to sample uniformly over the set of the real numbers? Can you even simulate it?
nth comment for small n
It would be cool if the terms used in this video were explained a bit. Up until 13:00 I thought that mu is meant to be value at maximum, not the point at which maximum occurs, which was pretty confusing
For some very important statistical applications though, we would never adopt a biased estimator for a more precise one, for example where we want to make a causal inference
In 1982 I contacted Dr Ephron at Stanford University and on his help used the JS estimates for stands of bottom land forest in Arkansas, Louisiana and? Mississippi. These stands were residual acres of valuable cypress and oaks?
Are we trying to find the best estimator for all the datasets? For the estimate of µ1 (2:54), you say it's better to include the points from other datasets. Why would the existence of unrelated data change anything about µ1?
That's the paradox! But yes, we are finding an estimator that reduces the overall error rather than individual errors.
@@mathemaniac in that case, isn't it just that some sort of centroid of the 3 estimators would be best for reducing overall error? (that doesnt seem like a paradox anymore)
1990's Wonder Years Algebra Teacher: Every problem contains it's own solution.
2023 AI: Convergence to true.
You are exceptionally clear!!!!! I hope this channel grows!!!
Thank you so much!
@@mathemaniac I am doing my PhD in Information Theory in Biophysics and I have never heard about this estimator!! Very enriching.
Ooh I use a lot of smoothing/shrinkage stats models and have seen the JS estimator a few times mentioned in my reference books. Excited to see cool video about it.
The original baseball example (that you link to in the description) is still really good. The players’ batting averages are independent and a player’s past performance should be the best predictor of their future performance but the shrinkage smooths some noise out.
謝謝!
Chaos in statistics community: just another day
11:57 To anyone who were struck like me by the fact that JS may work better even when the shrinkage factor makes its components negative, and so even if you knew for physical reasons that the actual means can't be negative: the thing is that the SD were standardized to 1, so you will basically never sample really small numbers if you assume that 99.9% of the data are positive, making the actual means larger than 3 or 4 in the standardized scale.
I am really not sure what you mean by "never really sample really small numbers", because you definitely can sample really small numbers under the SD assumption.
@@mathemaniac Sure, the Gaussian function never vanishes, but it does become incredibly small quite fast. If you want to implement the assumption that "(basically) all observations are positive", together with the assumption that SD=1, it makes the event of the shrinking factor being negative very unlikely.
3:13 the way you phrased this makes it sound like i can better estimate whether my crush likes me if i also take under consideration the alignment of the planets on the day of her birth and how much wood a given woodchuck chucked, given that a woodchuck would chuck wood
no because real data isnt a perfect bell curve.
also a paradox by definition is absurd on its face. thats the entire point of a paradox
Since the problem seems to me invariant by change of origin, one could also pull the estimated point towards another point than (0,0,0)? What would be the formula in this case?
Should we replace the naive estimate by λ*naive_estimate+(1-λ)*shrinkage_target ; with λ being the shrinkage coefficient : (1 - 1/||naive_estimate - shrinkage_target||²)?
@7:24
whta's an "ordinary estimator"?
what's a naive guess?
why is "naive guess (7)" in blue, when it's in pink @6:33?
what is the y axis in this plot?
Excellent content, research, pace and presentation. Thank you for putting this together and explaining it in simpler terms than the paper :)
Amazing video. What does it come next? Cant wait for it